Hola, Habr.
Un área bastante interesante de "estadísticas aplicadas" y NLP (Procesamiento de lenguajes naturales y nada de lo que muchos piensan ahora) es el análisis de texto. Esta dirección apareció mucho antes que las computadoras y tenía un objetivo completamente práctico: determinar el autor de tal o cual texto. Sin embargo, con la ayuda de una PC, es mucho más fácil y conveniente, y los resultados son bastante interesantes. Veamos qué patrones se pueden identificar usando un código Python muy simple.
Para aquellos que estén interesados, la continuación bajo el corte.
Historia
Una de las primeras tareas prácticas fue determinar la autoría de los textos políticos The Federalist Papers , escritos en los Estados Unidos en la década de 1780. Sus autores fueron varias personas, pero quién es quién, se desconocía por completo. El primer enfoque para construir la curva de distribución de la longitud de las palabras se retomó en 1851 , y uno puede imaginar cuánto trabajo fue. Ahora, gracias a Dios, todo es más fácil. Consideraré la forma más simple de análisis usando cálculos simples y el paquete Natural Language Toolkit , que, junto con matplotlib, le permite obtener resultados interesantes en solo unas pocas líneas de código. Veremos cómo se puede visualizar todo esto y qué patrones se pueden ver.
Los interesados en los resultados pueden omitir el capítulo "código".
El código
. :
s = """
, . ,
: ?"""
nltk:
import nltk
nltk.data.find('tokenizers/punkt')
tokens = nltk.word_tokenize(s)
tokens :
['', '', '', '', '', '', '', '', '',
'', '', '', '', ',', '', ...]
, :
import string
remove_punctuation = str.maketrans('', '', string.punctuation)
tokens_ = [x for x in [t.translate(remove_punctuation).lower() for t in tokens] if len(x) > 0]
: . .
text = nltk.Text(tokens_)
lexical_diversity = (len(set(text)) / len(text)) * 100
96.6%.
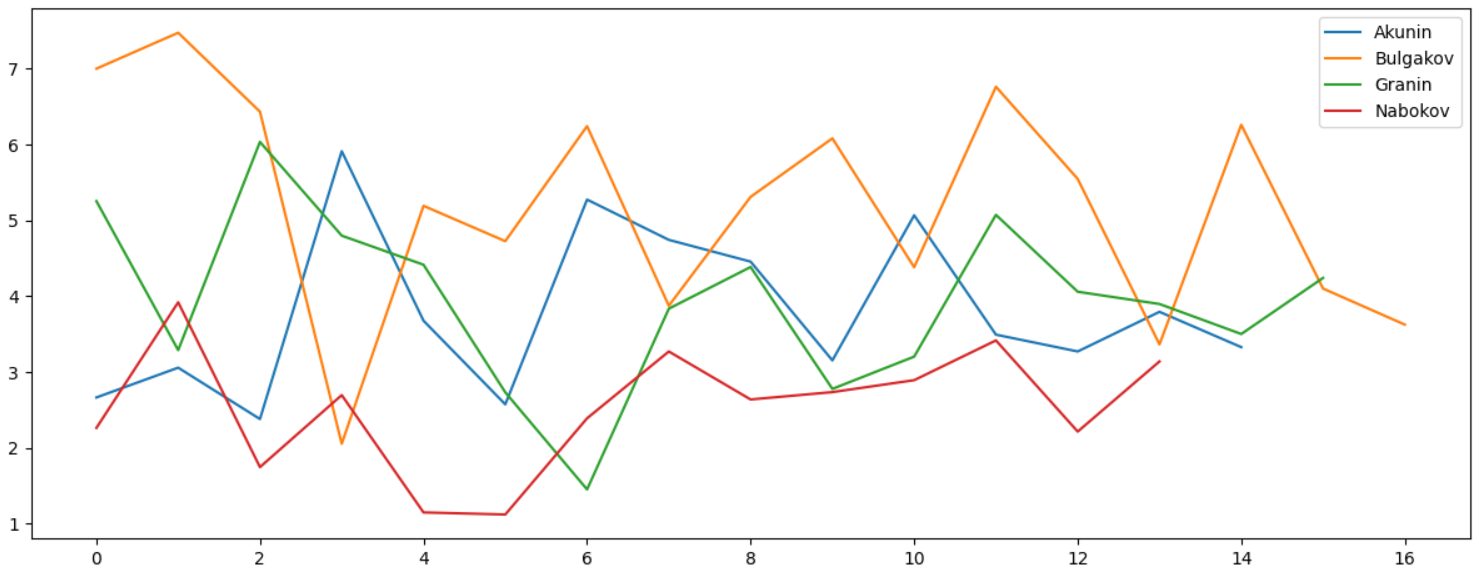
:
words = set(tokens_)
word_chars = [len(word) for word in words]
mean_word_len = sum(word_chars) / float(len(word_chars))
set(tokens_) , , . 4.86.
sent_tokenize NLTK, , , .
import numpy as np
sentences = nltk.sent_tokenize(s)
sentence_word_length = [len(sent.split()) for sent in sentences]
mean_sentence_len = np.mean(sentence_word_length)
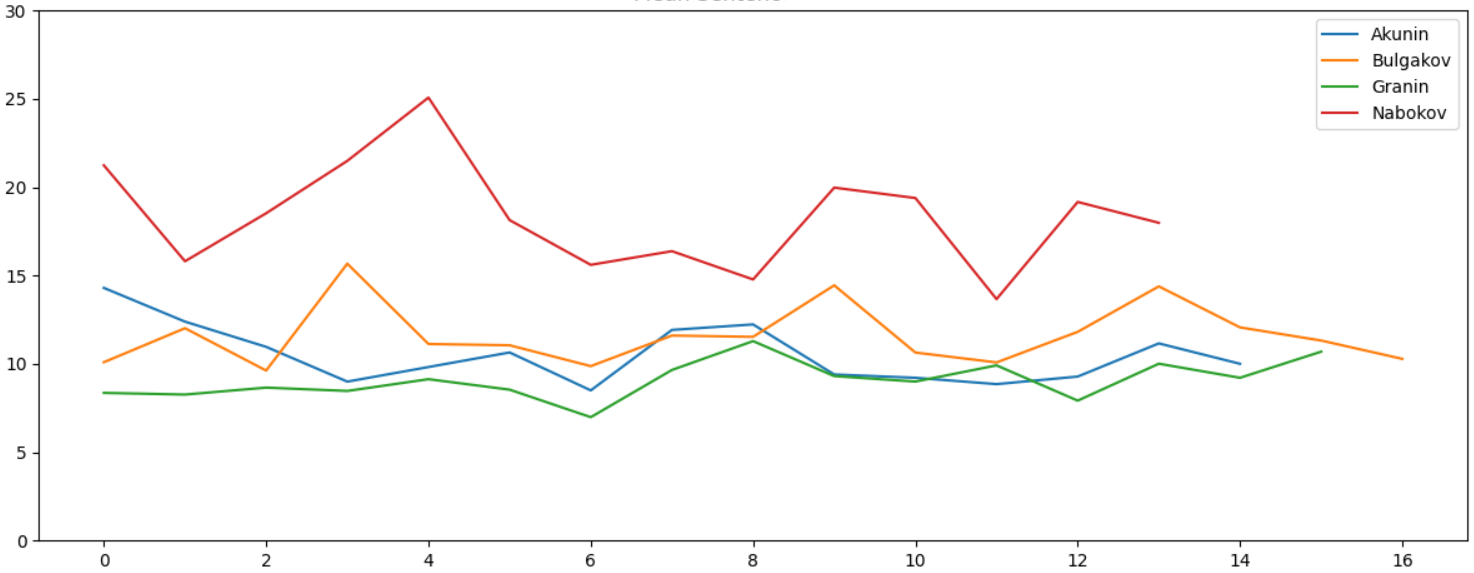
15 .
- . , , ("", ""). 1000 :
fdist = nltk.probability.FreqDist(nltk.Text(tokens))
commas_per_thousand = (fdist[","] * 1000) / fdist.N()
57.14 1000 .
, - .
import codecs
try:
doc = codecs.open(file_name, 'r', 'cp1251').read()
except:
doc = codecs.open(file_name, 'r', 'utf-8').read()
, . , -, 1251. copy-paste , UTF-8. 1251, UTF-8, .
. , . 4 , Lib.ru. , .
- :
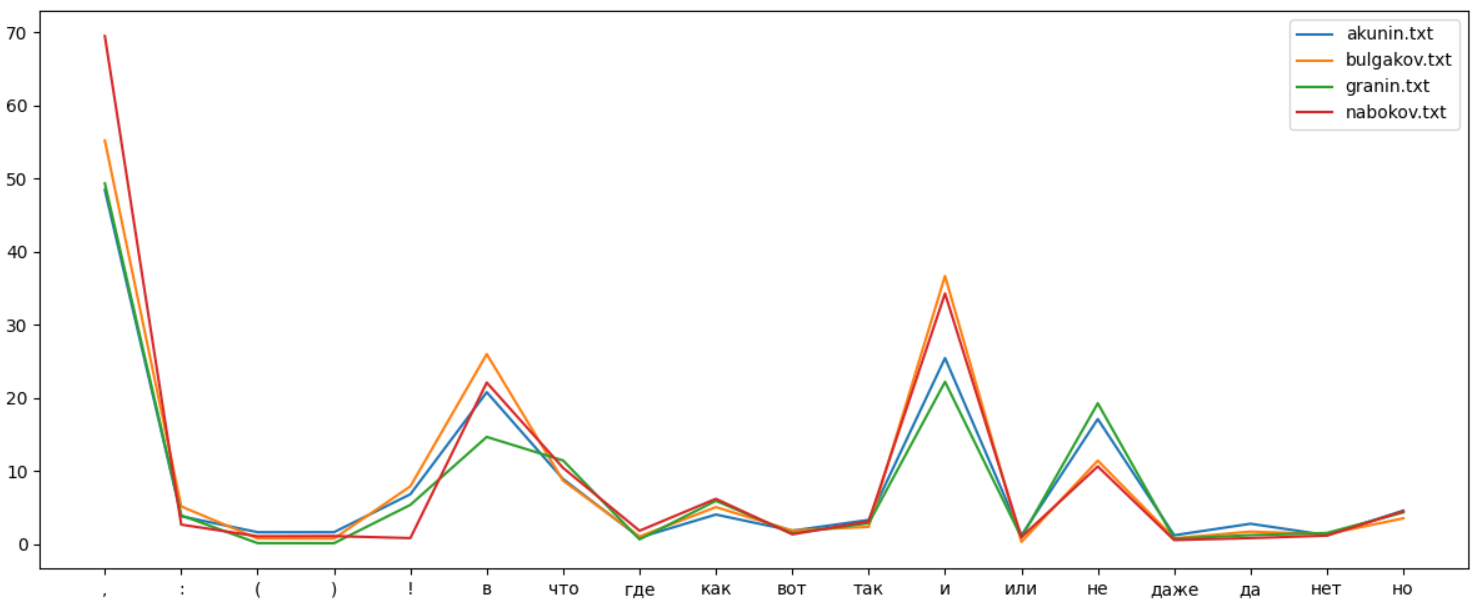
, , , - . " " . :
, , , . - , :
, , , , , , , , , , , , , , , , .
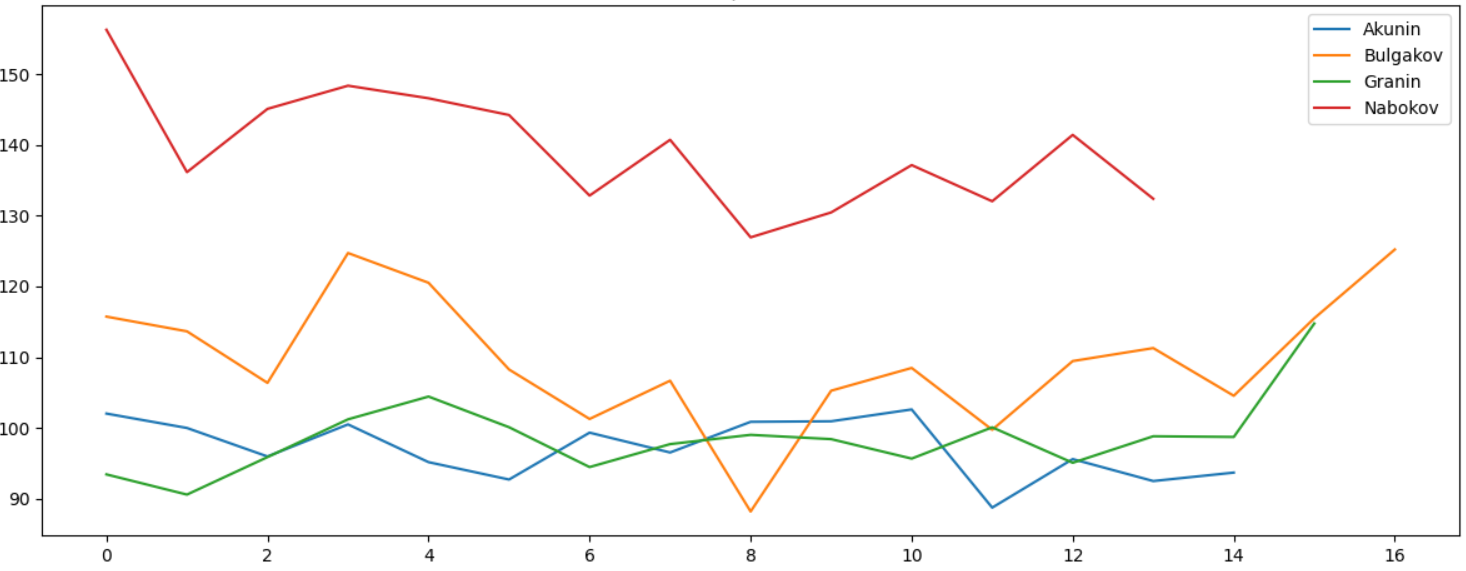
1000 , - , , :
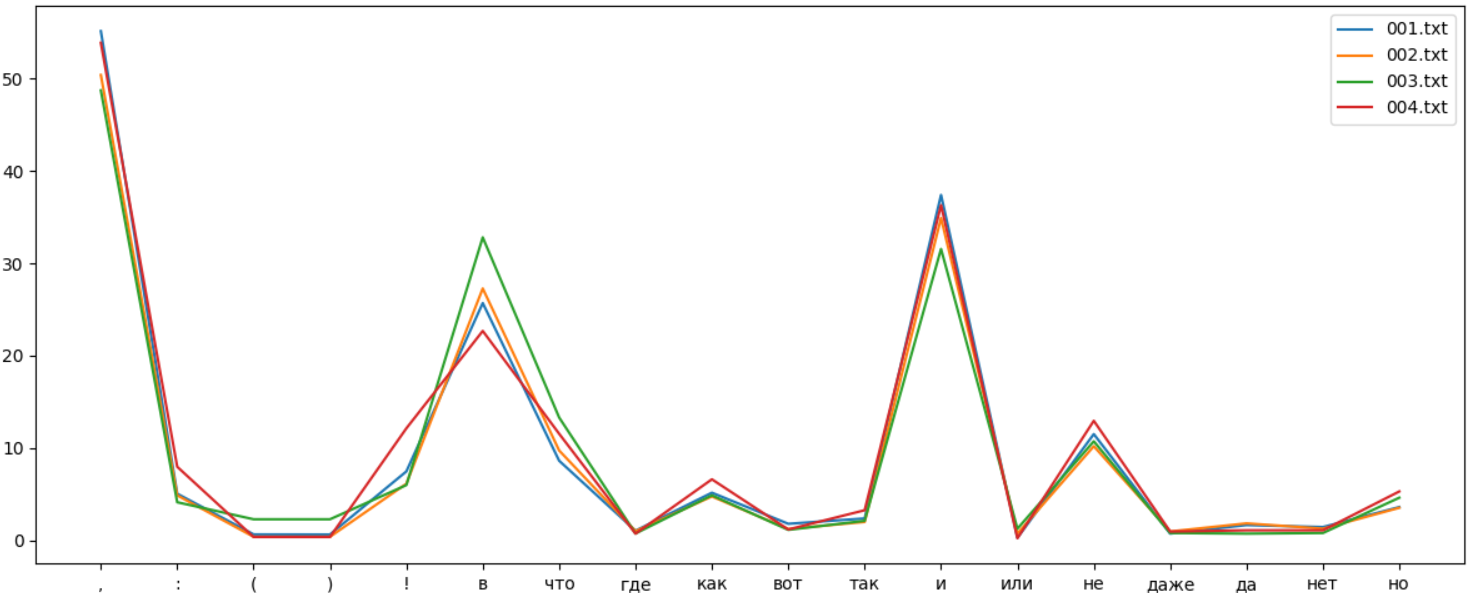
, , , , ":":
, :
, . , :
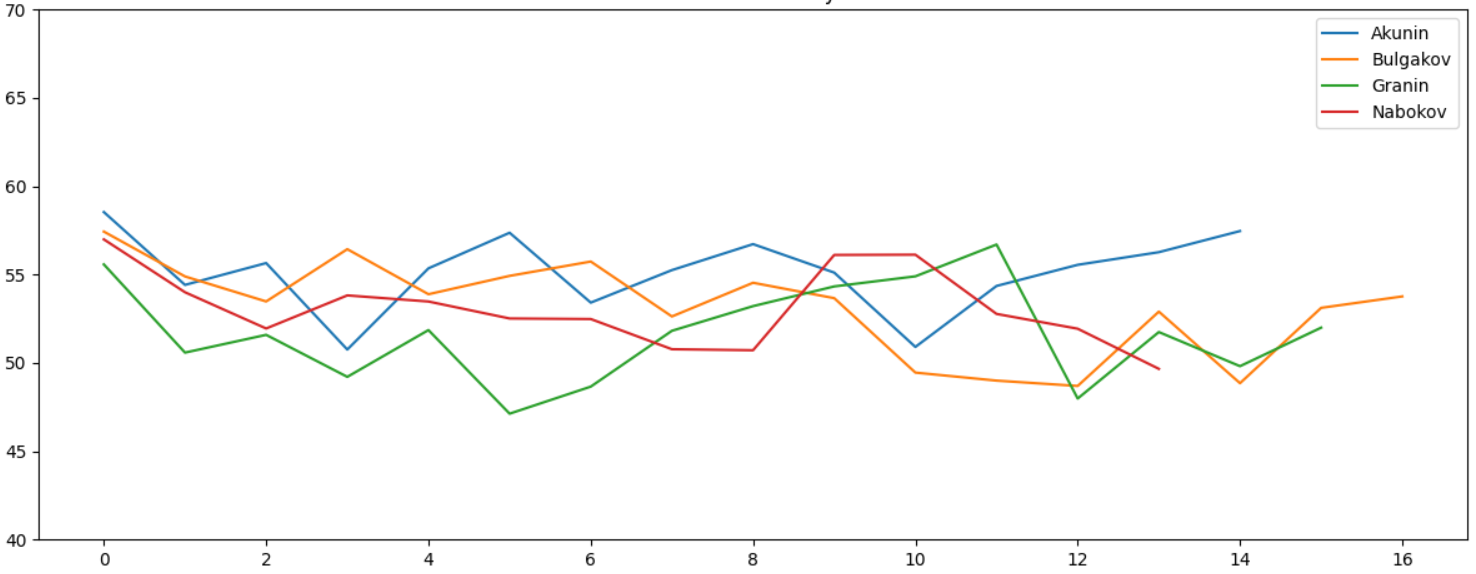
. " " , . Lexical Diversity. , :
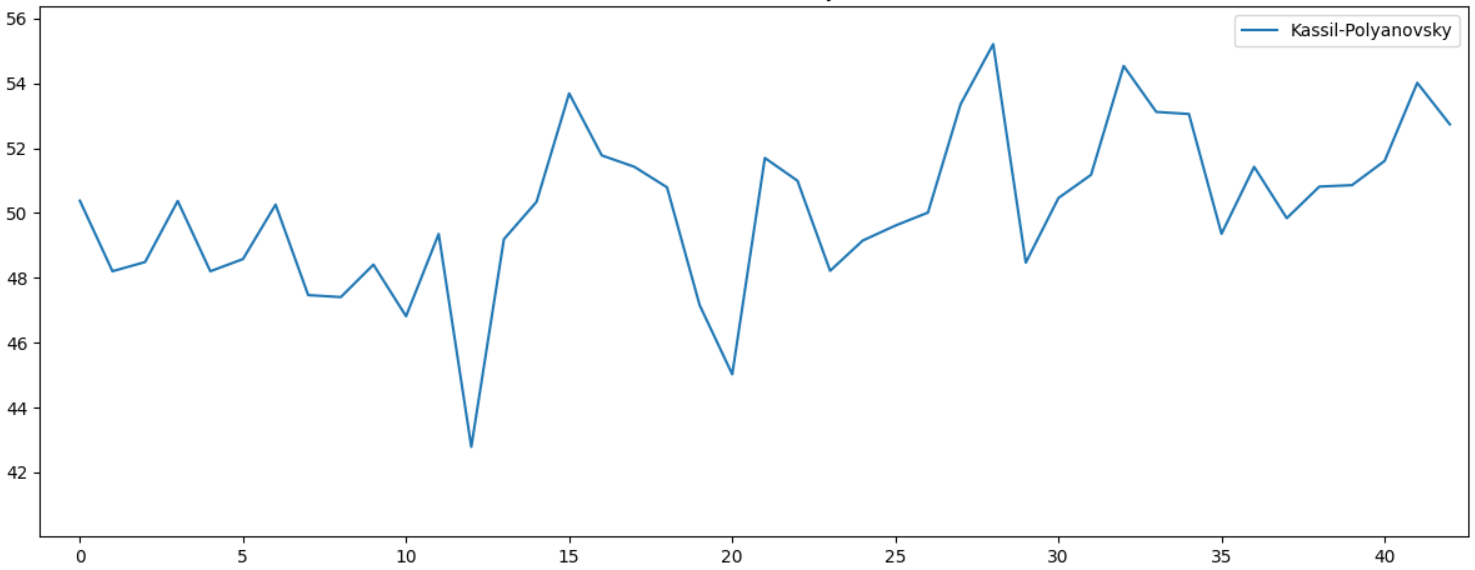
, . 10 , . , . , - , :
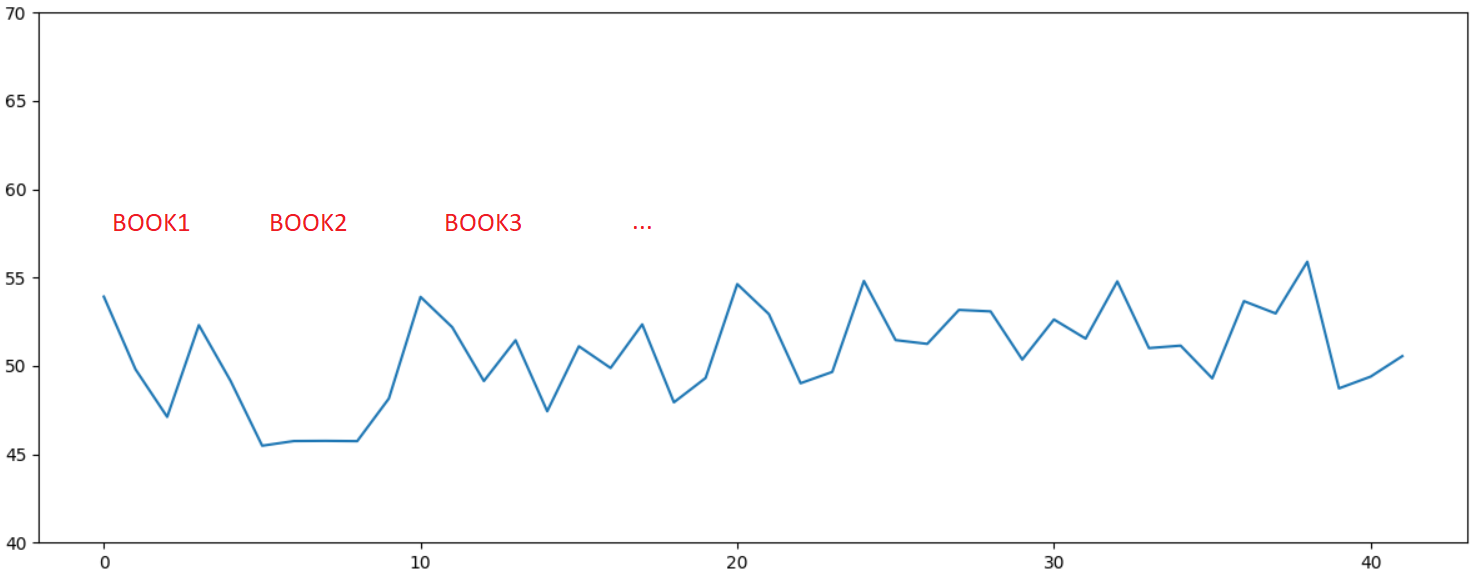
, , , , ...
. , , , .
, Python 3.7 .
text_process.py
import nltk, codecs
import numpy as np
import pandas as pd
import matplotlib.pyplot as plt
from typing import Optional, List
import string
import glob
import sys, os
def get_articles_from_blob(folder: str):
data = []
for path in glob.glob(folder + os.sep + "*"):
print(path)
data += get_articles_from_folder(path)
return data
def get_articles_from_folder(folder: str):
data = []
for path in glob.glob(folder + os.sep + "*.txt"):
data += get_data_from_file(path)
return [(folder.split(os.sep)[-1], data)]
def get_data_from_file(file_name: str):
print("Get data for %s" % file_name)
try:
doc = codecs.open(file_name, 'r', 'cp1251').read()
except:
doc = codecs.open(file_name, 'r', 'utf-8').read()
chunk_size = 25000
data = []
for part in [doc[i:i+chunk_size] for i in range(0, len(doc) - (len(doc) % chunk_size), chunk_size)]:
data.append(get_data_from_str(part[part.find(' '):part.rfind(' ')]))
return data
def get_data_from_str(doc: str):
tokens = nltk.word_tokenize(doc)
remove_punctuation = str.maketrans('', '', string.punctuation)
tokens_ = [x for x in [t.translate(remove_punctuation).lower() for t in tokens] if len(x) > 0]
text = nltk.Text(tokens_)
lexical_diversity = (len(set(text)) / len(text)) * 100
words = set(tokens_)
word_chars = [len(word) for word in words]
mean_word_len = sum(word_chars) / float(len(word_chars))
sentences = nltk.sent_tokenize(doc)
sentence_word_length = [len(sent.split()) for sent in sentences]
mean_sentence_len = np.mean(sentence_word_length)
fdist = nltk.probability.FreqDist(nltk.Text(tokens))
commas_per_thousand = (fdist[","] * 1000) / fdist.N()
return (lexical_diversity, mean_word_len, mean_sentence_len, commas_per_thousand)
def plot_data(data):
plt.rcParams["figure.figsize"] = (12, 5)
fig, ax = plt.subplots()
plt.title('Lexical diversity')
for author, author_data in data:
plt.plot(list(map(lambda val: val[0], author_data)), label=author)
plt.ylim([40, 70])
# plt.title('Mean Word Length')
# for author, author_data in data:
# plt.plot(list(map(lambda val: val[1], author_data)), label=author)
# plt.ylim([4, 8])
# plt.title('Mean Sentence Length')
# for author, author_data in data:
# plt.plot(list(map(lambda val: val[2], author_data)), label=author)
# plt.ylim([0, 30])
# plt.title("Commas per thousand")
# for author, author_data in data:
# plt.plot(list(map(lambda val: val[3], author_data)), label=author)
plt.legend(loc='upper right')
plt.tight_layout()
plt.show()
def get_freqs_from_folder(folder: str):
freqs_data = []
for path in glob.glob(folder + os.sep + "*.txt"):
print("Get data for %s" % path)
try:
doc = codecs.open(path, 'r', 'cp1251').read()
except:
doc = codecs.open(path, 'r', 'utf-8').read()
symbols, freqs = get_freqs_from_str(doc)
freqs_data.append((path.split(os.sep)[-1], symbols, freqs))
return freqs_data
def get_freqs_from_str(doc: str):
tokens = nltk.word_tokenize(doc)
tokens = [x for x in [t.lower() for t in tokens]]
fdist = nltk.probability.FreqDist(nltk.Text(tokens))
symbols = [",", ":", "(", ")", "!", "", "", "", "", "", "", "", "", "", "", "", "", ""]
freqs = []
for s in symbols:
freq = (fdist[s] * 1000) / fdist.N()
if s == ",":
freq /= 2
freqs.append(freq)
return (symbols, freqs)
def plot_freqs(data):
plt.rcParams["figure.figsize"] = (12, 5)
for author, symbols, freqs in data:
plt.plot(symbols, freqs, label=author)
plt.legend(loc='upper right')
plt.tight_layout()
plt.show()
if __name__ == "__main__":
# Download punkt tokenizer
try:
nltk.data.find('tokenizers/punkt')
except LookupError:
nltk.download('punkt')
# Process text files
# data = get_articles_from_blob("Folder") # Folder/AuthorXX/Text.txt
data = get_articles_from_folder("folder_here") # Folder with files
plot_data(data)
# Process frequency curve
data = get_freqs_from_folder("folder_here")
plot_freqs(data)