Prefacio
Todos los ejemplos que se presentarán en el artículo se pueden encontrar en este cuaderno , el material principal estará oculto debajo de los spoilers debido a que hay mucho código y gifs. Para reproducir algunos de los ejemplos que se presentarán en cualquier caso, necesitará este repositorio debido a que contiene algunas utilidades intermedias.
Como animar
En Jupyter hay un conjunto de widgets ( ipywidgets ), que son varios tipos de herramientas de gestión, que interactúan con el módulo IPython.display para proporcionar visualización interactiva. El siguiente código representa toda la interacción del widget clave que se puede utilizar para animar de forma interactiva el contenido de una lista:
from ipywidgets import interact, interactive, fixed, interact_manual
import ipywidgets as widgets
from IPython.display import display


def step_slice(lst, step):
    return lst[step]


def animate_list(lst, play=False, interval=200):
    slider = widgets.IntSlider(min=0, max=len(lst) - 1, step=1, value=0)
    if play:
        play_widjet = widgets.Play(interval=interval)
        widgets.jslink((play_widjet, 'value'), (slider, 'value'))
        display(play_widjet)
        # slider = widgets.Box([play_widject, slider])
    return interact(step_slice,
                    lst=fixed(lst),
                    step=slider)
Esto es lo que obtiene si alimenta la función animate_list con una lista de enteros:
a = [10, 9, 8, 7, 6, 5, 4, 3, 2, 1]
animate_list(a, play=True, interval=200);
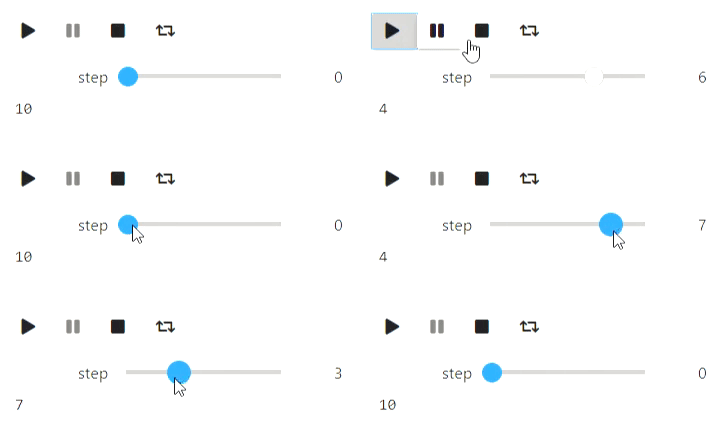
Para demostrar cómo funciona un algoritmo usando animate_list, necesita generar estados intermedios del algoritmo y guardar su representación visual en el formato deseado.
Animaciones de texto
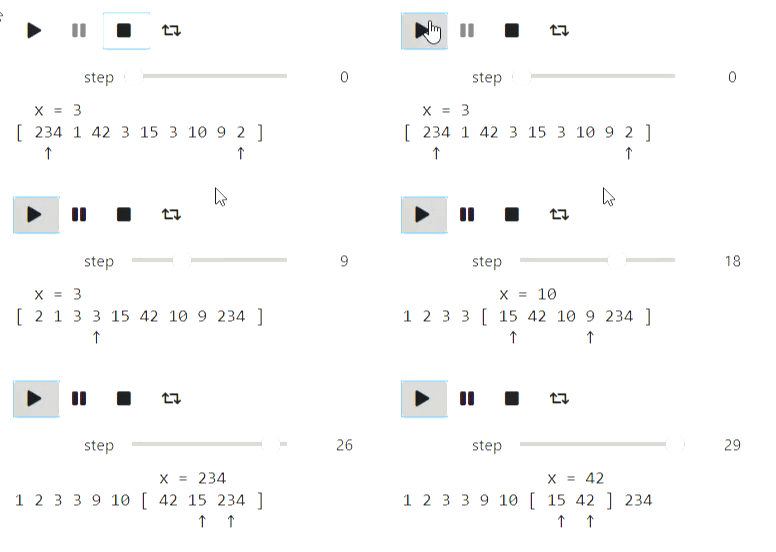
Los algoritmos básicos para trabajar con secuencias / matrices son suficiente representación textual. Desafortunadamente, tuve problemas con las cadenas básicas que se negaban a manejar los avances de línea, como resultado usé IPython.display.Code. Comencemos con la clasificación rápida clásica.
El código
from IPython.display import Code
import random

def qsort_state(array, left, right, x, p, q):
    extended_array = list(map(str, array[:left])) + ['['] + list(map(str, array[left: right])) + [']'] + list(map(str, array[right:]))
    offset_x = sum(list(map(len, extended_array[:left]))) + left + 2
    zero_line = ''.join([' ' for i in range(offset_x)]) + f'x = {x}'
    first_line = ' '.join(extended_array)
    offset_p = sum(list(map(len, extended_array[:p + 1]))) + p + 1 + len(extended_array[p + 1]) // 2
    offset_q = sum(list(map(len, extended_array[:q + 1]))) + q + 1 + len(extended_array[q + 1]) // 2
    second_line = ''.join([' ' if i != offset_p and i != offset_q else '↑' for i in range(len(first_line))])

    return Code(zero_line + '\n' + first_line + '\n' + second_line)

def qsort(array, left, right, states):
    if right - left <= 1:
        return
    x = array[random.randint(left, right - 1)]
    p = left
    q = right - 1
    states.append(qsort_state(array, left, right, x, p, q))
    while p <= q:
        while array[p] < x:
            p += 1
            states.append(qsort_state(array, left, right, x, p, q))
        while array[q] > x:
            q -= 1
            states.append(qsort_state(array, left, right, x, p, q))
        if p <= q:
            array[p], array[q] = (array[q], array[p])
            states.append(qsort_state(array, left, right, x, p, q))
            p += 1
            q -= 1
            if p <= q:
                states.append(qsort_state(array, left, right, x, p, q))
    qsort(array, left, q + 1, states)
    qsort(array, p, right, states)
a = [234, 1, 42, 3, 15, 3, 10, 9, 2]
states = []
qsort(a, 0, len(a), states)
animate_list(states, play=True);
Resultado

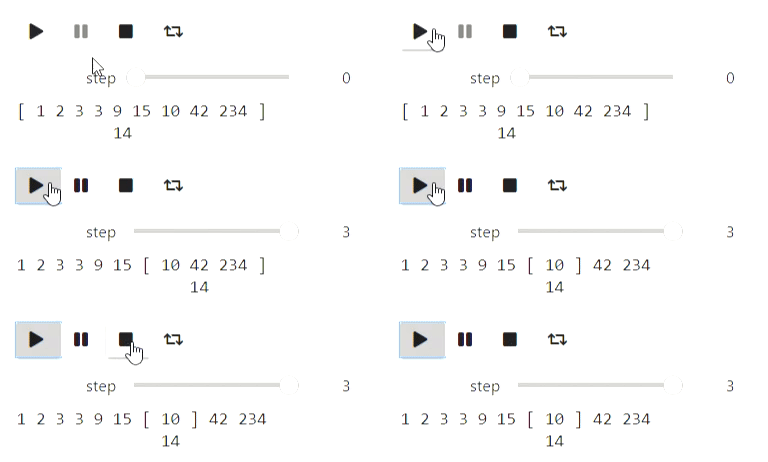
La búsqueda binaria se puede visualizar de forma similar.
El código
def bs_state(array, left, right, x):
    extended_array = list(map(str, array[:left])) + ['['] + list(map(str, array[left: right])) + [']'] + list(map(str, array[right:]))
    mid = (left + right) // 2
    offset_x = sum(list(map(len, extended_array[:mid + 1]))) + mid + 1
    return Code(' '.join(extended_array) + '\n' + ''.join([' ' for i in range(offset_x)]) + str(x))

#       ,
#
states = []
left = 0
right = len(a)
x = 14
while right - left > 1:
    states.append(bs_state(a, left, right, x))
    mid = (left + right) // 2
    if a[mid] <= x:
        left = mid
    else:
        right = mid
states.append(bs_state(a, left, right, x))

animate_list(states, play=True, interval=400);
Resultado

Y aquí hay un ejemplo de cadenas: el proceso de construcción de una función de prefijo:
El código
def prefix_function_state(s, p, k, intermidiate=False):
    third_string = ''.join([s[i] if i < k else ' ' for i in range(len(p))])
    fourth_string = ''.join([s[i] if i >= len(p) - k else ' ' for i in range(len(p))])
    return Code(s + '\n' + ''.join(list(map(str, (p + ['*'] if intermidiate else p )))) \
                  + '\n' + third_string + '\n' + fourth_string)

def prefix_function(s, states):
    p = [0]
    k = 0
    states.append(prefix_function_state(s, p, k))
    for letter in s[1:]:
        states.append(prefix_function_state(s, p, k, True))
        while k > 0 and s[k] != letter:
            k = p[k - 1]
            states.append(prefix_function_state(s, p, k, True))
        if s[k] == letter:
            k += 1
        p.append(k)
        states.append(prefix_function_state(s, p, k))
    return p

states = []
p = prefix_function('ababadababa', states)
animate_list(states, play=True);
Resultado
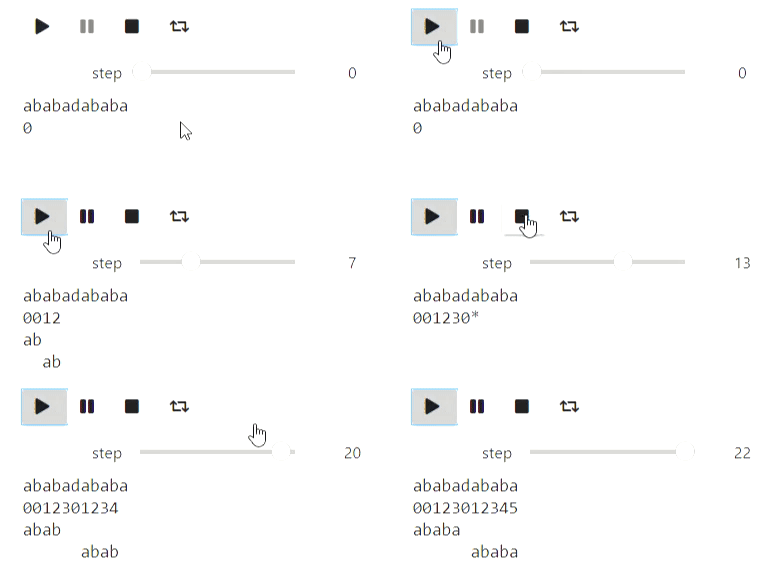

Visualización usando Matplotlib
Matplotlib es una biblioteca de Python para dibujar varios gráficos. A continuación, se muestran algunos ejemplos de cómo puede utilizarlo para visualizar algoritmos. Comencemos con un ejemplo de algoritmos iterativos para encontrar el mínimo de una función, el más simple de los cuales es el método de búsqueda local aleatoria, que hace un cambio local en la aproximación actual y entra en él si el valor del valor de la función en el nuevo punto resulta ser mejor:
El código
import numpy as np
import matplotlib.pyplot as plt

# ,  ,    (0, 0)
def f(x, y):
    return 1.3 * (x - y) ** 2 + 0.7 * (x + y) ** 2

#
def plot_trajectory(func, traj, limit_point=None):
    fig = plt.figure(figsize=(7, 7))
    ax = fig.add_axes([0, 0, 1, 1])

    if limit_point:
        ax.plot([limit_point[0]], [limit_point[1]], 'o', color='green')
    #Level contours
    delta = 0.025
    x = np.arange(-2, 2, delta)
    y = np.arange(-2, 2, delta)
    X, Y = np.meshgrid(x, y)
    Z = np.zeros_like(X)
    for i in range(X.shape[0]):
        for j in range(X.shape[1]):
            Z[i][j] = func(X[i][j], Y[i][j])
    CS = ax.contour(X, Y, Z, [0.5, 1.5, 3], colors=['blue', 'purple', 'red'])
    ax.plot([u[0] for u in traj], [u[1] for u in traj], color='black')
    ax.plot([u[0] for u in traj], [u[1] for u in traj], 'o', color='black')

    plt.close(fig)
    return fig

x, y = (1.0, 1.0)
num_iters = 50
trajectory = [(x, y)]
plots = []
#
for i in range(num_iters):
    angle = 2 * np.pi * np.random.rand(1)
    dx, dy = (np.cos(angle) / 2 / (i + 1) ** 0.5, np.sin(angle) / 2 / (i + 1) ** 0.5)
    trajectory.append((x + dx, y + dy))
    plots.append(plot_trajectory(f, trajectory, limit_point=(0, 0)))
    if f(x, y) > f(x + dx, y + dy):
        x = x + dx
        y = y + dy
    else:
        trajectory = trajectory[:-1]

animate_list(plots, play=True, interval=300);
Resultado
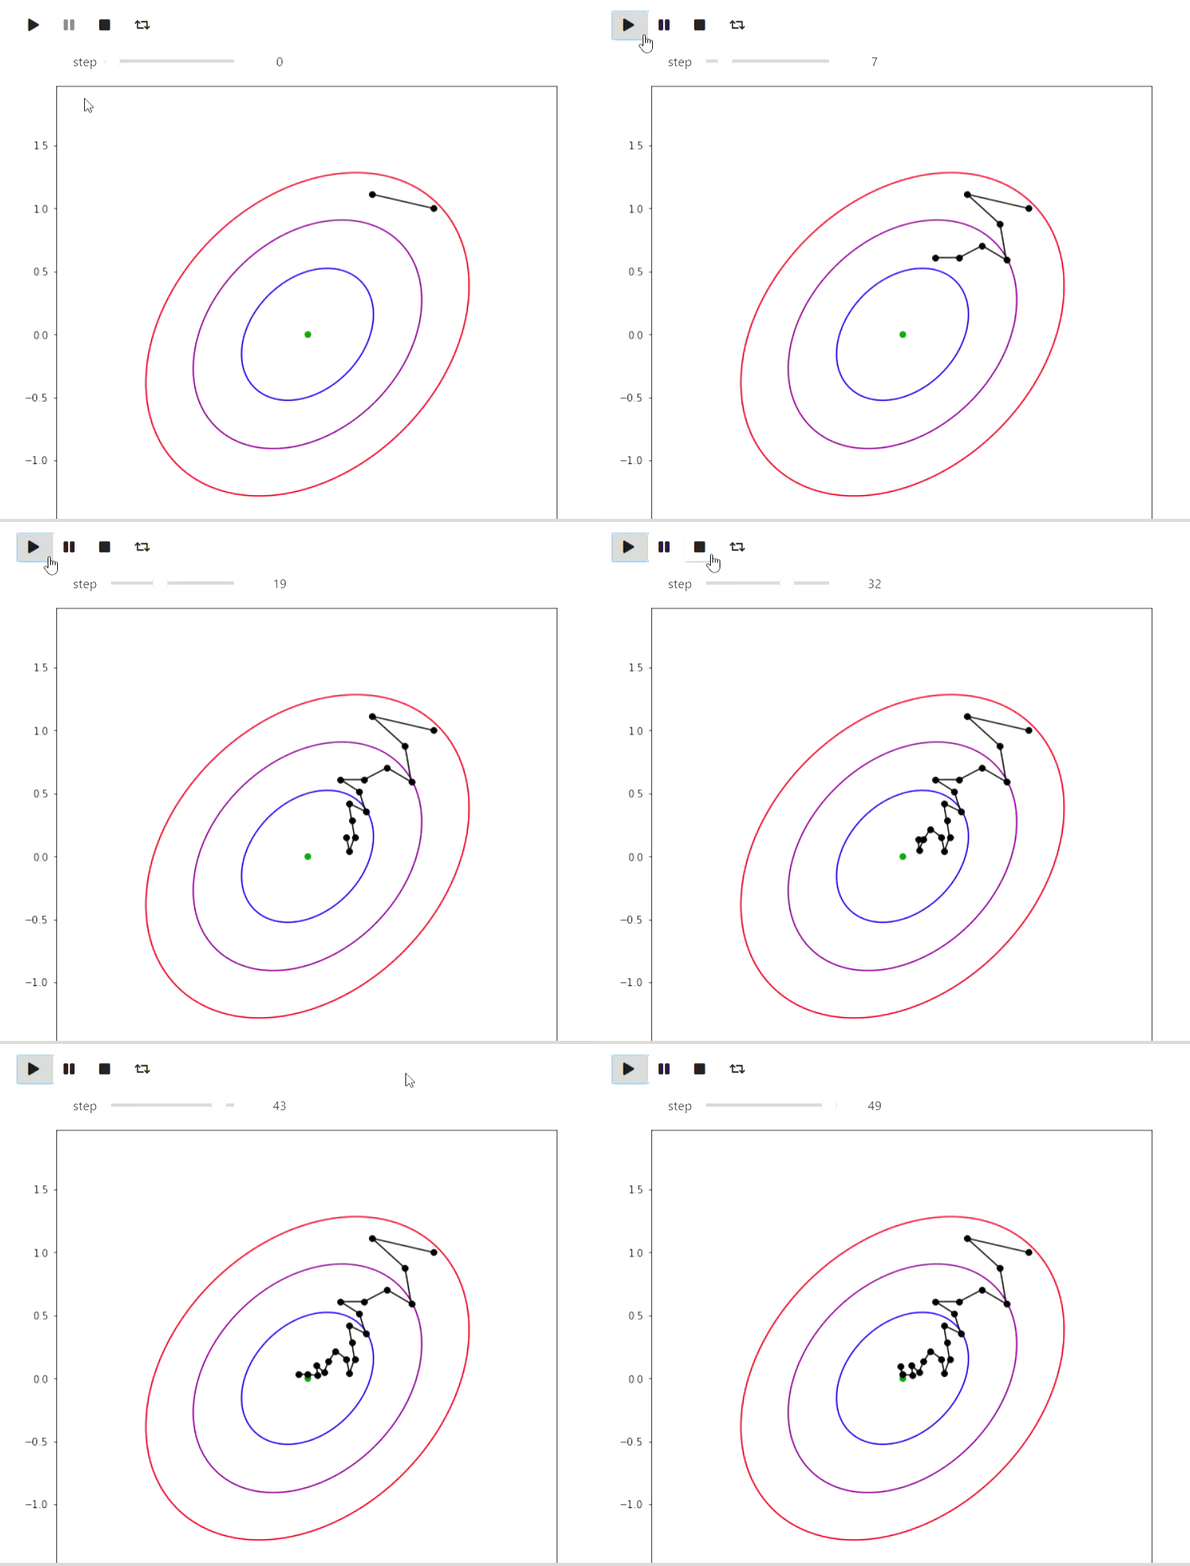

Y aquí hay un ejemplo del algoritmo EM para datos de las erupciones de un géiser Old Faithful, el mismo ejemplo se da en Wikipedia :
El código
#
# http://www.stat.cmu.edu/~larry/all-of-statistics/=data/faithful.dat
data = []
with open('data/faithful.csv') as f:
    for line in f:
        _, x, y = line.split(',')
        try:
            data.append((float(x), float(y)))
        except ValueError:
            pass

colors = ['red', 'blue', 'yellow', 'green']

#    https://jakevdp.github.io/PythonDataScienceHandbook/05.12-gaussian-mixtures.html
from matplotlib.patches import Ellipse

def draw_ellipse(position, covariance, ax=None, **kwargs):
    """Draw an ellipse with a given position and covariance"""
    ax = ax or plt.gca()

    # Convert covariance to principal axes
    if covariance.shape == (2, 2):
        U, s, Vt = np.linalg.svd(covariance)
        angle = np.degrees(np.arctan2(U[1, 0], U[0, 0]))
        width, height = 2 * np.sqrt(s)
    else:
        angle = 0
        width, height = 2 * np.sqrt(covariance)

    # Draw the Ellipse
    for nsig in range(1, 4):
        ax.add_patch(Ellipse(position, nsig * width, nsig * height,
                             angle, color='red', **kwargs))

def plot_gmm(gmm, X, label=True, ax=None):
    ax = ax or plt.gca()
    if label:
        labels = gmm.predict(X)
        ax.scatter(X[:, 0], X[:, 1], c=labels, s=20, cmap='plasma', zorder=2)
    else:
        ax.scatter(X[:, 0], X[:, 1], s=20, zorder=2)

    w_factor = 0.2 / gmm.weights_.max()
    for pos, covar, w in zip(gmm.means_, gmm.covariances_, gmm.weights_):
        draw_ellipse(pos, covar, alpha=w * w_factor)

def step_figure(gmm, X, label=True):
    fig = plt.figure(figsize=(7, 7))
    ax = fig.add_axes([0, 0, 1, 1])
    ax.set_ylim(30, 100)
    ax.set_xlim(1, 6)
    plot_gmm(gmm, X, label=True, ax=ax)
    plt.close(fig)
    return fig

from sklearn.mixture import GaussianMixture

x = np.array(data)
# max_iters=1  warm_start=True  gmm.fit
#
gmm = GaussianMixture(2, warm_start=True, init_params='random', max_iter=1)
# GMM    ,
import warnings
warnings.simplefilter('ignore')
#
gmm.fit(x[:10,:])
steps = [step_figure(gmm, x)]
for i in range(17):
    gmm.fit(x)
    steps.append(step_figure(gmm, x))

animate_list(steps, play=True, interval=400);
Resultado
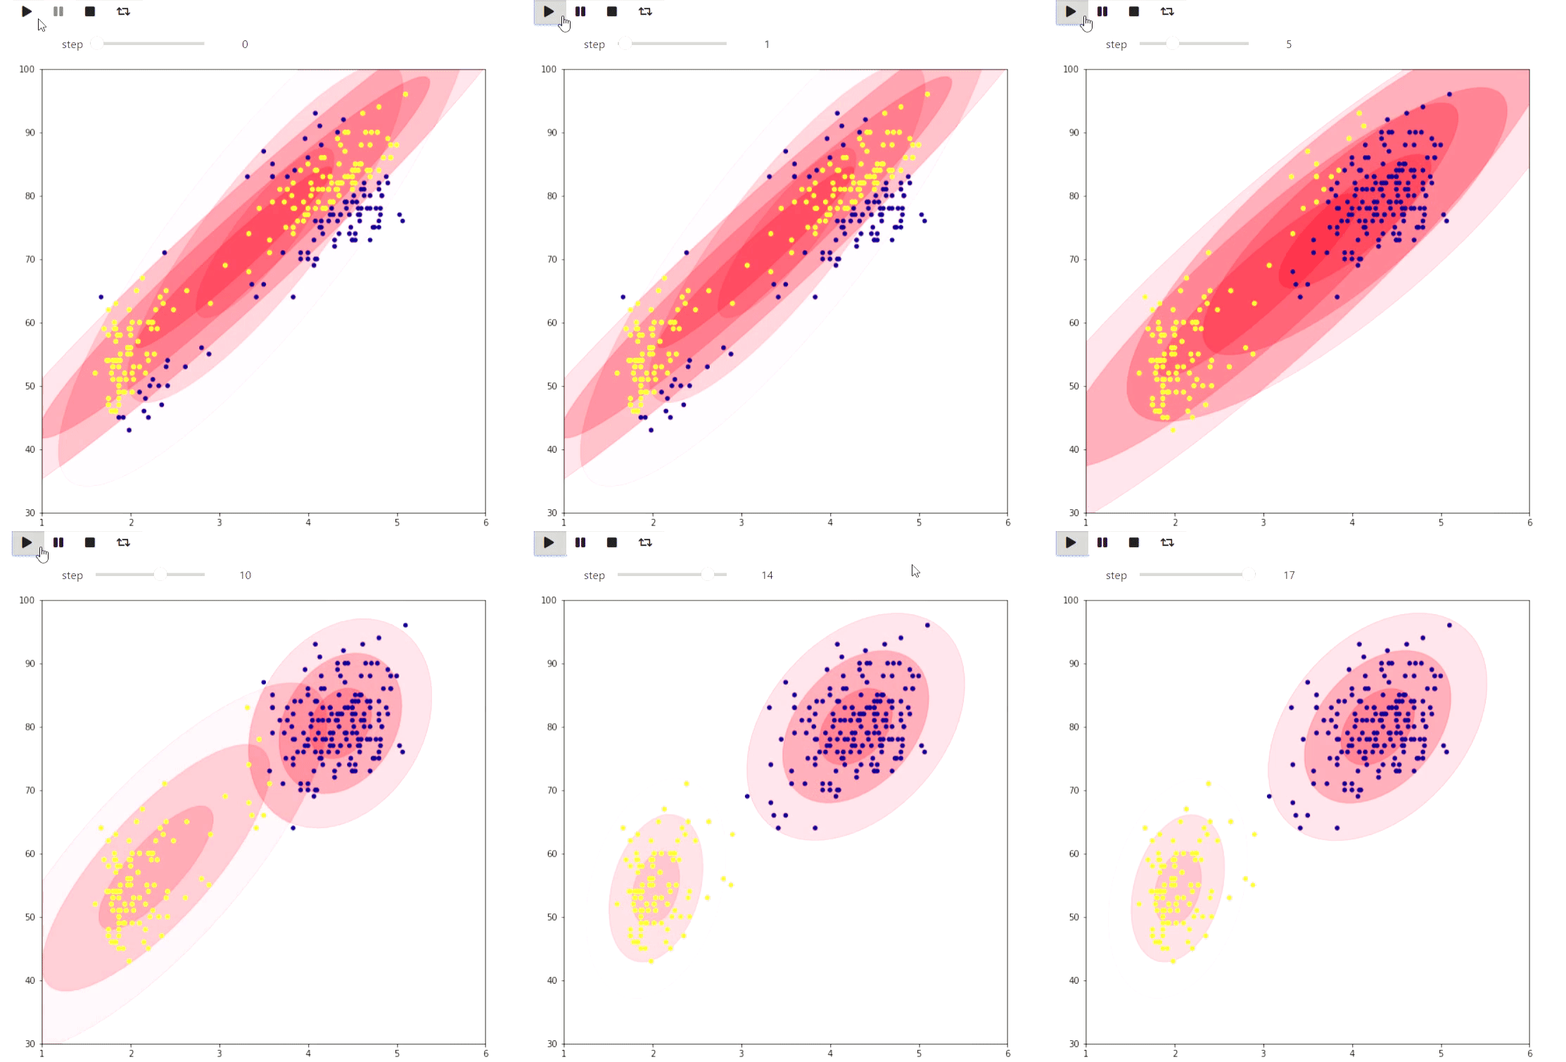

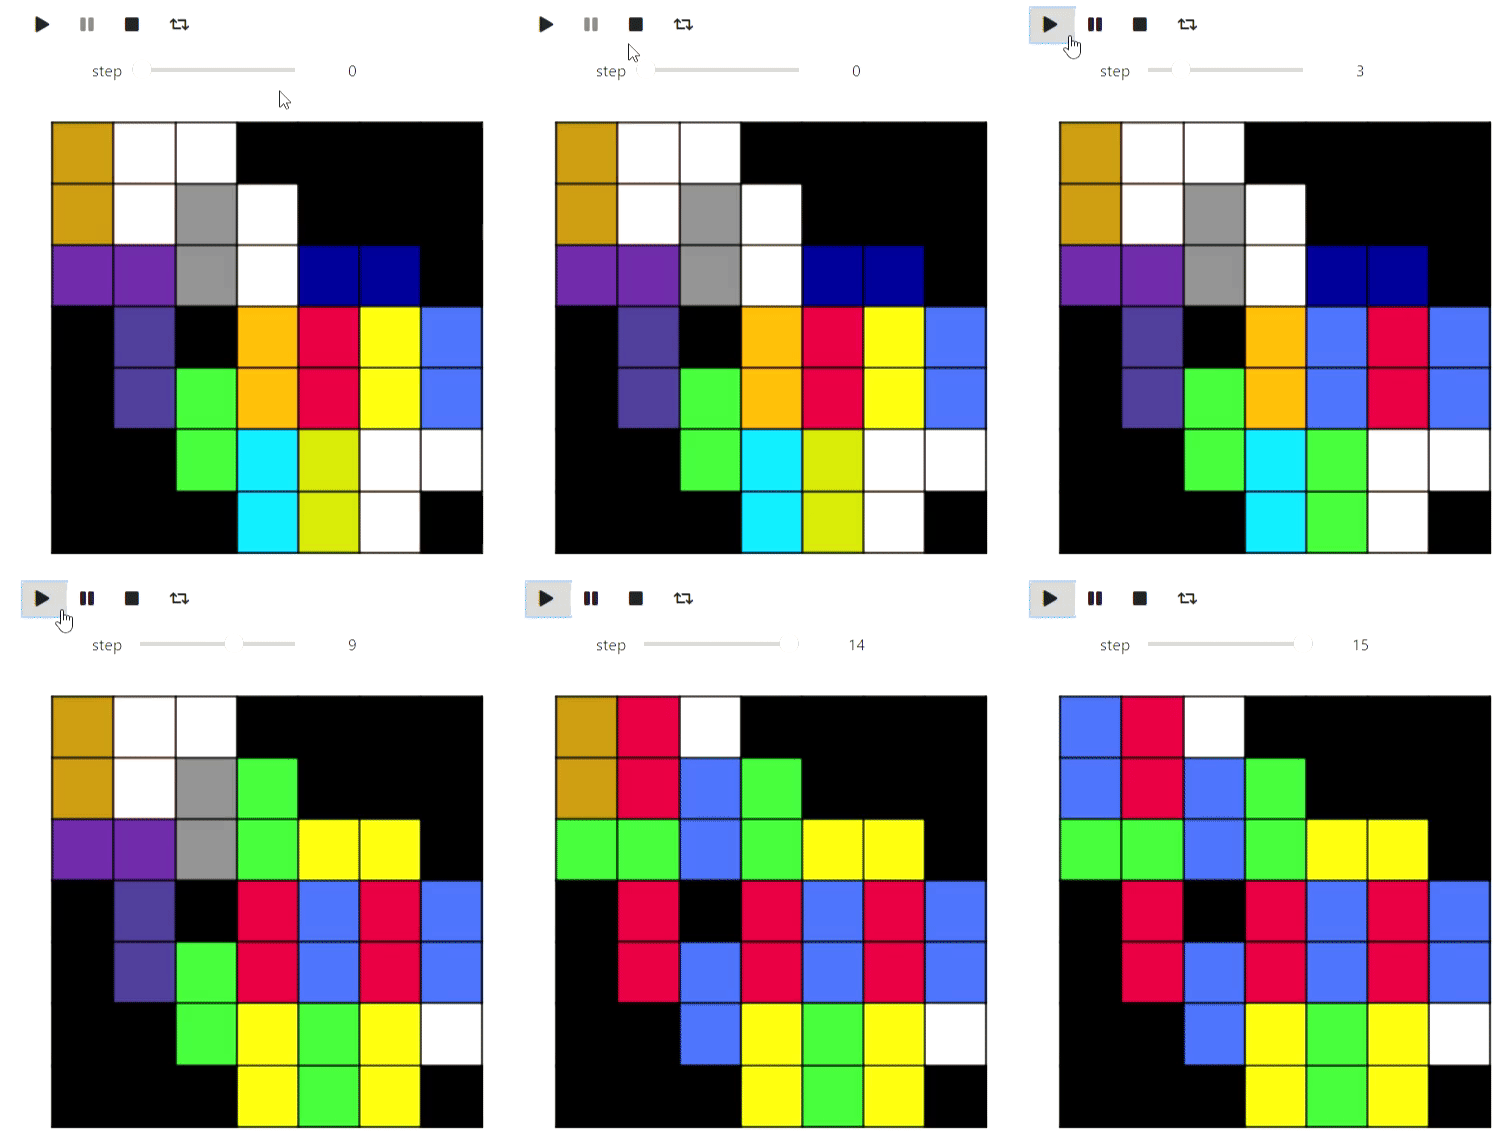
El siguiente ejemplo es más un juguete, pero también muestra lo que se puede hacer en matplotlib: visualizar el mosaico de una figura a cuadros en un plano con el número máximo de dominós al encontrar la coincidencia máxima:
El código
#   matplotlib   ,
from animation_utils.matplotlib import draw_filling

def check_valid(i, j, n, m, tiling):
    return 0 <= i and i < n and 0 <= j and j < m and tiling[i][j] != '#'

def find_augmenting_path(x, y, n, m, visited, matched, tiling):
    if not check_valid(x, y, n, m, tiling):
        return False
    if (x, y) in visited:
        return False
    visited.add((x, y))

    for dx, dy in [(-1, 0), (1, 0), (0, -1), (0, 1)]:
        if not check_valid(x + dx, y + dy, n, m, tiling):
            continue
        if (x + dx, y + dy) not in matched or find_augmenting_path(*matched[(x + dx , y + dy)], n, m, visited, matched, tiling):
            matched[(x + dx, y + dy)] = (x, y)
            return True
    return False

def convert_match(matched, tiling, n, m):
    result = [[-1 if tiling[i][j] == '#' else -2 for j in range(m)] for i in range(n)]
    num = 0
    for x, y in matched:
        _x, _y = matched[(x, y)]
        result[x][y] = num
        result[_x][_y] = num
        num += 1
    return result

def match_with_flow(tiling):
    result_slices = []
    n = len(tiling)
    m = len(tiling[0])

    matched = dict()
    #
    rows = list(range(n))
    columns = list(range(m))
    random.shuffle(rows)
    random.shuffle(columns)
    result_slices.append(convert_match(matched, tiling, n, m))

    for i in rows:
        for j in columns:
            if (i + j) % 2 == 1:
                continue
            visited = set()
            if find_augmenting_path(i, j, n, m, visited, matched, tiling):
                result_slices.append(convert_match(matched, tiling, n, m))

    return result_slices

tiling_custom=[
    '...####',
    '....###',
    '......#',
    '#.#....',
    '#......',
    '##.....',
    '###...#',
]
sequencial_match = match_with_flow(tiling_custom)
animate_list(list(map(draw_filling, sequencial_match)), play=True);
Resultado
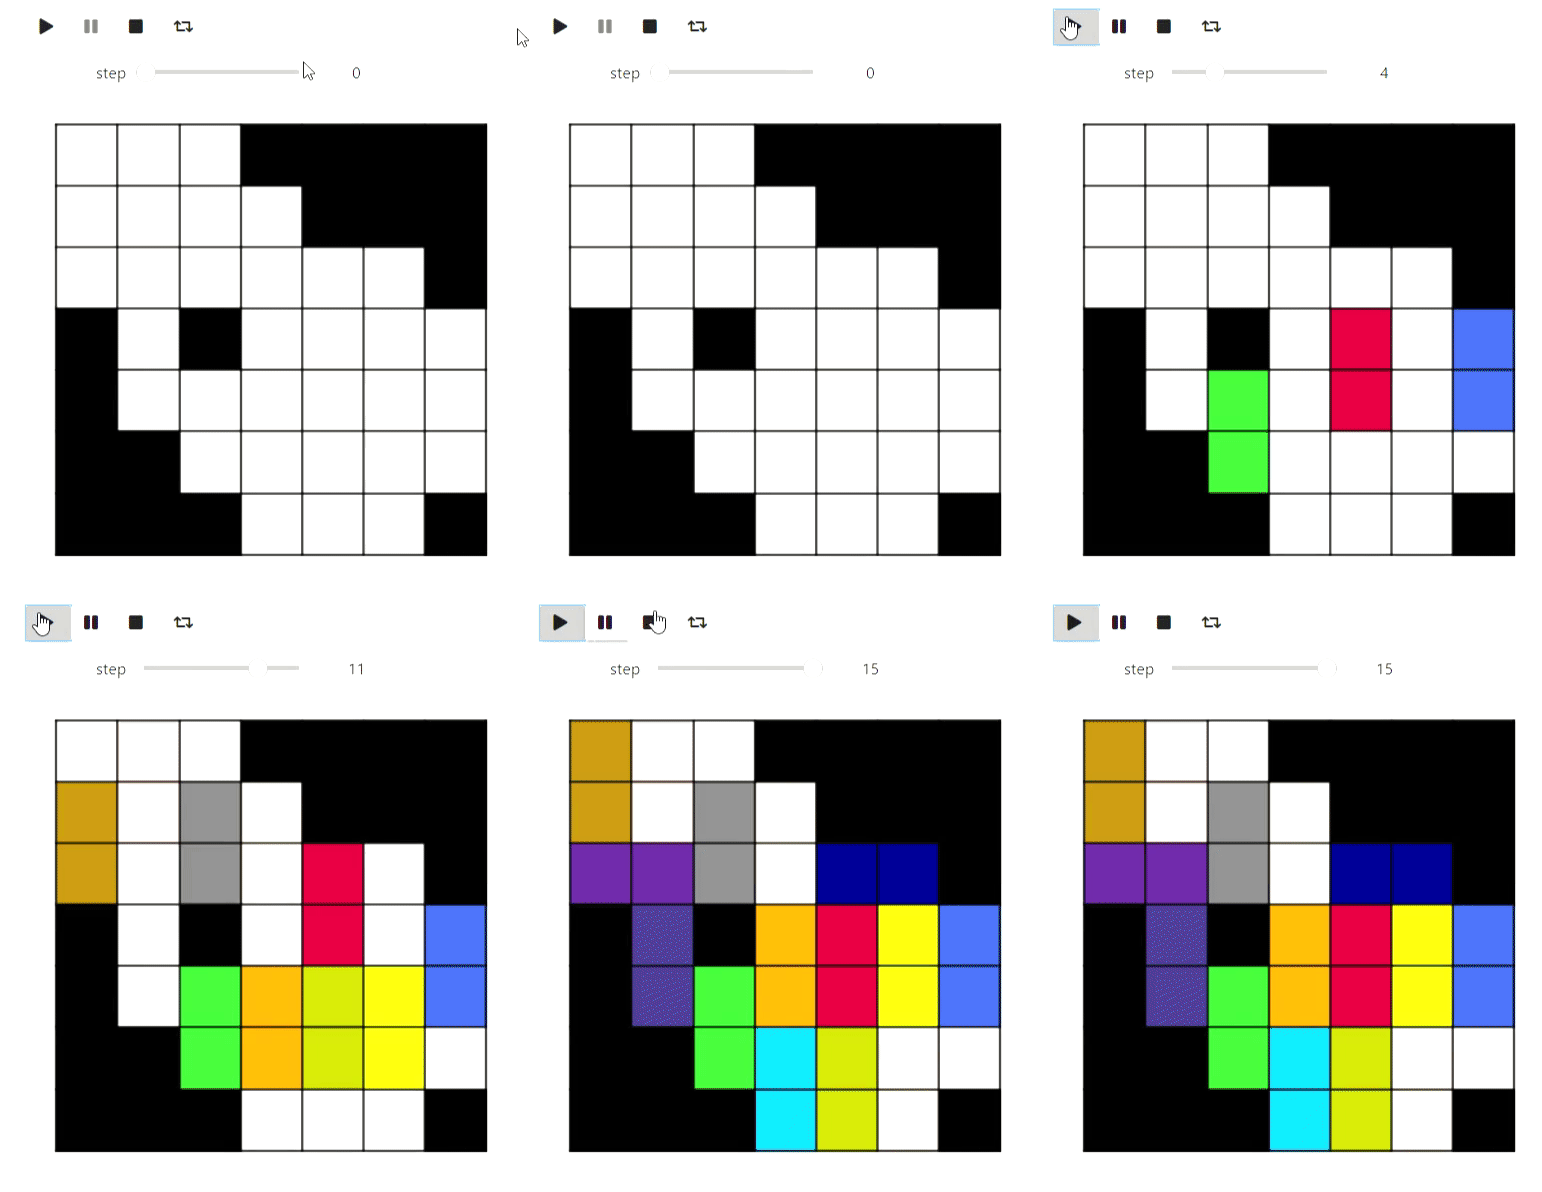

Bueno, en el camino, una demostración del algoritmo para colorear un gráfico plano en 5 colores, para que la partición se vea mejor visualmente:
El código
def color_5(filling):
    result = [[i for i in row] for row in filling]
    #
    domino_tiles = [[] for i in range(max(map(max, filling)) + 1)]
    domino_neighbours = [set() for i in range(max(map(max, filling)) + 1)]
    degree = [0 for i in range(max(map(max, filling)) + 1)]

    n = len(filling)
    m = len(filling[0])

    for i, row in enumerate(filling):
        for j, num in enumerate(row):
            if num >= 0:
                domino_tiles[num].append((i, j))

    for i, tiles in enumerate(domino_tiles):
        for x, y in tiles:
            for dx, dy in [(-1, 0), (1, 0), (0, -1), (0, 1), (-1, -1), (-1, 1), (1, -1), (1, 1)]:
                a, b = x + dx, y + dy
                if 0 <= a and a < n and 0 <= b and b < m and filling[a][b] >= 0 and filling[a][b] != i \
                        and filling[a][b] not in domino_neighbours[i]:
                    domino_neighbours[i].add(filling[a][b])
                    degree[i] += 1

    #       ,      5
    # .     ,   ,
    #           ,
    active_degrees = [set() for i in range(max(degree) + 1)]
    for i, deg in enumerate(degree):
        active_degrees[deg].add(i)

    reversed_order = []

    for step in range(len(domino_tiles)):
        min_degree = min([i for i, dominoes in enumerate(active_degrees) if len(dominoes) > 0])
        domino = active_degrees[min_degree].pop()

        reversed_order.append(domino)
        for other in domino_neighbours[domino]:
            if other in active_degrees[degree[other]]:
                active_degrees[degree[other]].remove(other)
                degree[other] -= 1
                active_degrees[degree[other]].add(other)

    #             ,
    #     5 ,      ,
    #    .
    colors = [-1 for domino in domino_tiles]
    slices = [draw_filling(result)]
    for domino in reversed(reversed_order):
        used_colors = [colors[other] for other in domino_neighbours[domino] if colors[other] != -1]

        domino_color = len(used_colors)
        for i, color in enumerate(sorted(set(used_colors))):
            if i != color:
                domino_color = i
                break

        if domino_color < 5:
            colors[domino] = domino_color
            for x, y in domino_tiles[domino]:
                result[x][y] = domino_color

            slices.append(draw_filling(result))
            continue

        #      ,
        c = 0
        other = [other for other in domino_neighbours[domino] if colors[other] == c]
        visited = set([other])
        q = Queue()
        q.put(other)
        domino_was_reached = False
        while not q.empty():
            cur = q.get()
            for other in domino_neighbours[cur]:
                if other == domino:
                    domino_was_reached = True
                    break
                if color[other] == c or color[other] == c + 1 and other not in visited:
                    visited.add(other)
                    q.put(other)

        if not domino_was_reached:
            for other in visited:
                color[other] = color[other] ^ 1
                for x, y in domino_tiles[other]:
                    result[x][y] = color[other]
            color[domino] = c
            for x, y in domino_tiles[domino]:
                result[x][y] = c

            slices.append(draw_filling(result))
            continue

        #     2  3.
        c = 2
        other = [other for other in domino_neighbours[domino] if colors[other] == c]
        visited = set([other])
        q = Queue()
        q.put(other)
        domino_was_reached = False
        while not q.empty():
            cur = q.get()
            for other in domino_neighbours[cur]:
                if other == domino:
                    domino_was_reached = True
                    break
                if color[other] == c or color[other] == c + 1 and other not in visited:
                    visited.add(other)
                    q.put(other)
        for other in visited:
            color[other] = color[other] ^ 1
            for x, y in domino_tiles[other]:
                result[x][y] = color[other]
        color[domino] = c
        for x, y in domino_tiles[domino]:
            result[x][y] = c
        slices.append(draw_filling(result))

    return result, slices

filling_colored, slices =color_5(sequencial_match[-1])
animate_list(slices, play=True);
Resultado

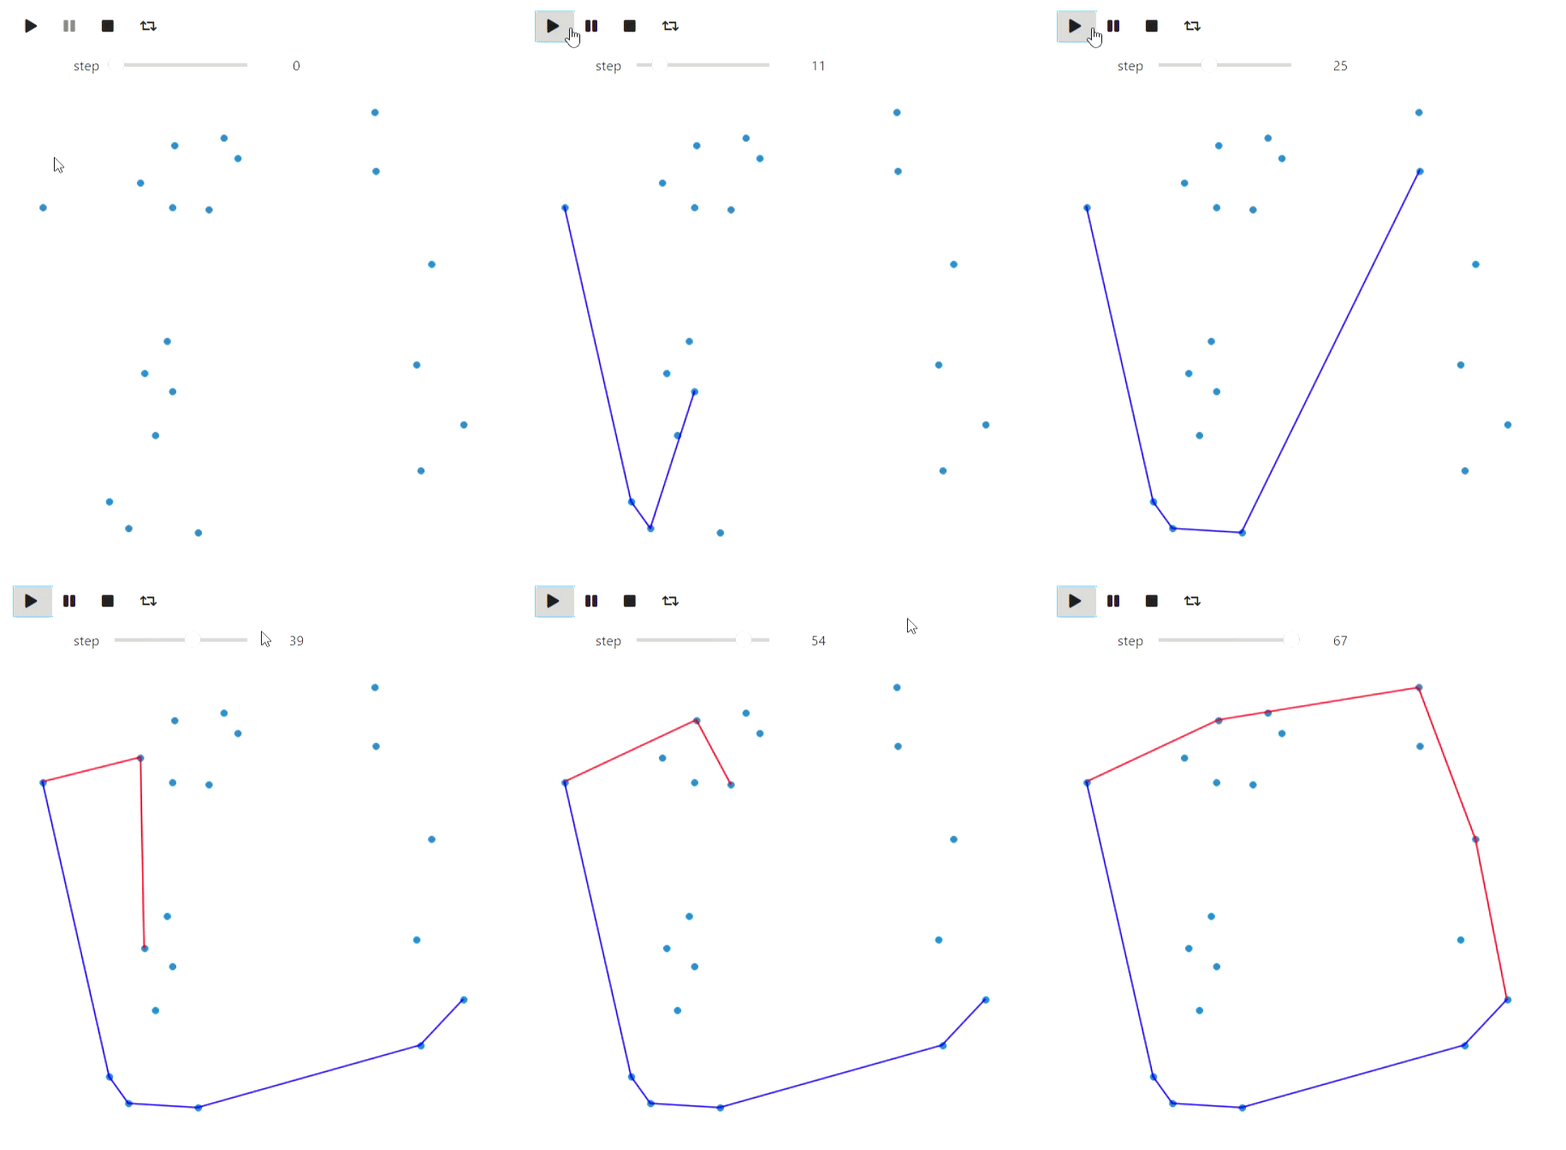
El último ejemplo con matplotlib de geometría computacional es el algoritmo de Graham-Andrew para trazar un casco convexo en un plano:
El código
def convex_hull_state(points, lower_path, upper_path):
    fig = plt.figure(figsize=(6, 6))
    ax = fig.add_axes([0, 0, 1, 1])

    ax.get_xaxis().set_visible(False)
    ax.get_yaxis().set_visible(False)

    for name, spine in ax.spines.items():
        spine.set_visible(False)
        spine.set_visible(False)

    ax.scatter([x for x, y in points], [y for x, y in points])
    ax.plot([x for x, _ in lower_path], [y for _, y in lower_path], color='red')
    ax.plot([x for x, _ in upper_path], [y for _, y in upper_path], color='blue')

    plt.close(fig)
    return fig

def vector_prod(point_a, point_b):
    return point_a[0] *  point_b[1] - point_a[1] * point_b[0]

def convex_hull(poitns):
    sorted_points = sorted(points, key=lambda x: x[1])
    sorted_points = sorted(sorted_points, key=lambda x: x[0])
    states = []

    upper_path = [sorted_points[0]]
    lower_path = [sorted_points[0]]
    states.append(convex_hull_state(points, lower_path, upper_path))

    for point in sorted_points[1:]:
        while len(upper_path) > 1 and vector_prod(point - upper_path[-1], upper_path[-1] - upper_path[-2]) > 0:
            upper_path = upper_path[:-1]
            upper_path.append(point)
            states.append(convex_hull_state(poitns, lower_path, upper_path))
            upper_path = upper_path[:-1]
        upper_path.append(point)
        states.append(convex_hull_state(points, lower_path, upper_path))

    for point in sorted_points[1:]:
        while len(lower_path) > 1 and vector_prod(point - lower_path[-1], lower_path[-1] - lower_path[-2]) < 0:
            lower_path = lower_path[:-1]
            lower_path.append(point)
            states.append(convex_hull_state(poitns, lower_path, upper_path))
            lower_path = lower_path[:-1]
        lower_path.append(point)
        states.append(convex_hull_state(poitns, lower_path, upper_path))

    return states

points = [np.random.rand(2) for i in range(20)]
states = convex_hull(points)
animate_list(states, play=True, interval=300);
Resultado

Lo último que me gustaría señalar en el contexto de matplotlib es una forma alternativa de crear animaciones a través de matplotlib.animation.FuncAnimation. Este método tiene sus ventajas: se puede convertir a html usando IPython.display.HTML, el resultado será más confiable que en los widgets (mis widgets se ralentizan periódicamente), no requerirá un núcleo de trabajo de Jupyter, pero en este caso la animación es normal el video y los controles están limitados al reproductor.
Graphviz
Graphviz se puede utilizar para dibujar gráficos. Tenga en cuenta que para reproducir ejemplos que lo usen, deberá instalar Graphviz no solo en Python, sino también en el sistema . Comencemos con un recorrido de profundidad primero:
El código
#
from graph_utils.graph import Graph, Arc, Node

def enter_node(node):
    node.SetColor('blue')

def enter_arc(node, arc):
    node.SetColor('green')
    arc.attributes['style'] = 'dashed'
    arc.attributes['color'] = 'green'

def return_from_arc(node, arc):
    arc.attributes['style'] = 'solid'
    arc.attributes['color'] = 'red'
    node.SetColor('blue')

def ignore_arc(arc):
    arc.attributes['color'] = 'blue'

def leave_node(node):
    node.SetColor('red')

def dfs(graph, node_id, visited, outlist, path):
    visited.add(node_id)
    path.append(node_id)
    enter_node(graph.nodes[node_id])
    outlist.append(graph.Visualize())
    for arc in graph.nodes[node_id].arcs:
        if arc.end not in visited:
            enter_arc(graph.nodes[node_id], arc)
            dfs(graph, arc.end, visited, outlist, path)
            return_from_arc(graph.nodes[node_id], arc)
            path.append(node_id)
        else:
            ignore_arc(arc)
        outlist.append(graph.Visualize())
    leave_node(graph.nodes[node_id])

arcs = [
    Arc(1, 3, 3),
    Arc(1, 4, 7),
    Arc(4, 3, 2),
    Arc(4, 5, 3),
    Arc(1, 5, 2),
    Arc(6, 4, 2),
    Arc(5, 6, 2),
    Arc(6, 7, 1),
    Arc(7, 2, 7),
    Arc(4, 2, 2),
    Arc(3, 2, 5)
]

#     ,      `dot`,
#      graphviz
# https://graphviz.org/download/
graph = Graph(arcs)
visited = set()
dfs_outlist = []
path = []
dfs_outlist.append(graph.Visualize())
dfs(graph, 1, visited, dfs_outlist, path)
dfs_outlist.append(graph.Visualize())
animate_list(dfs_outlist, play=True, interval=400);
Resultado
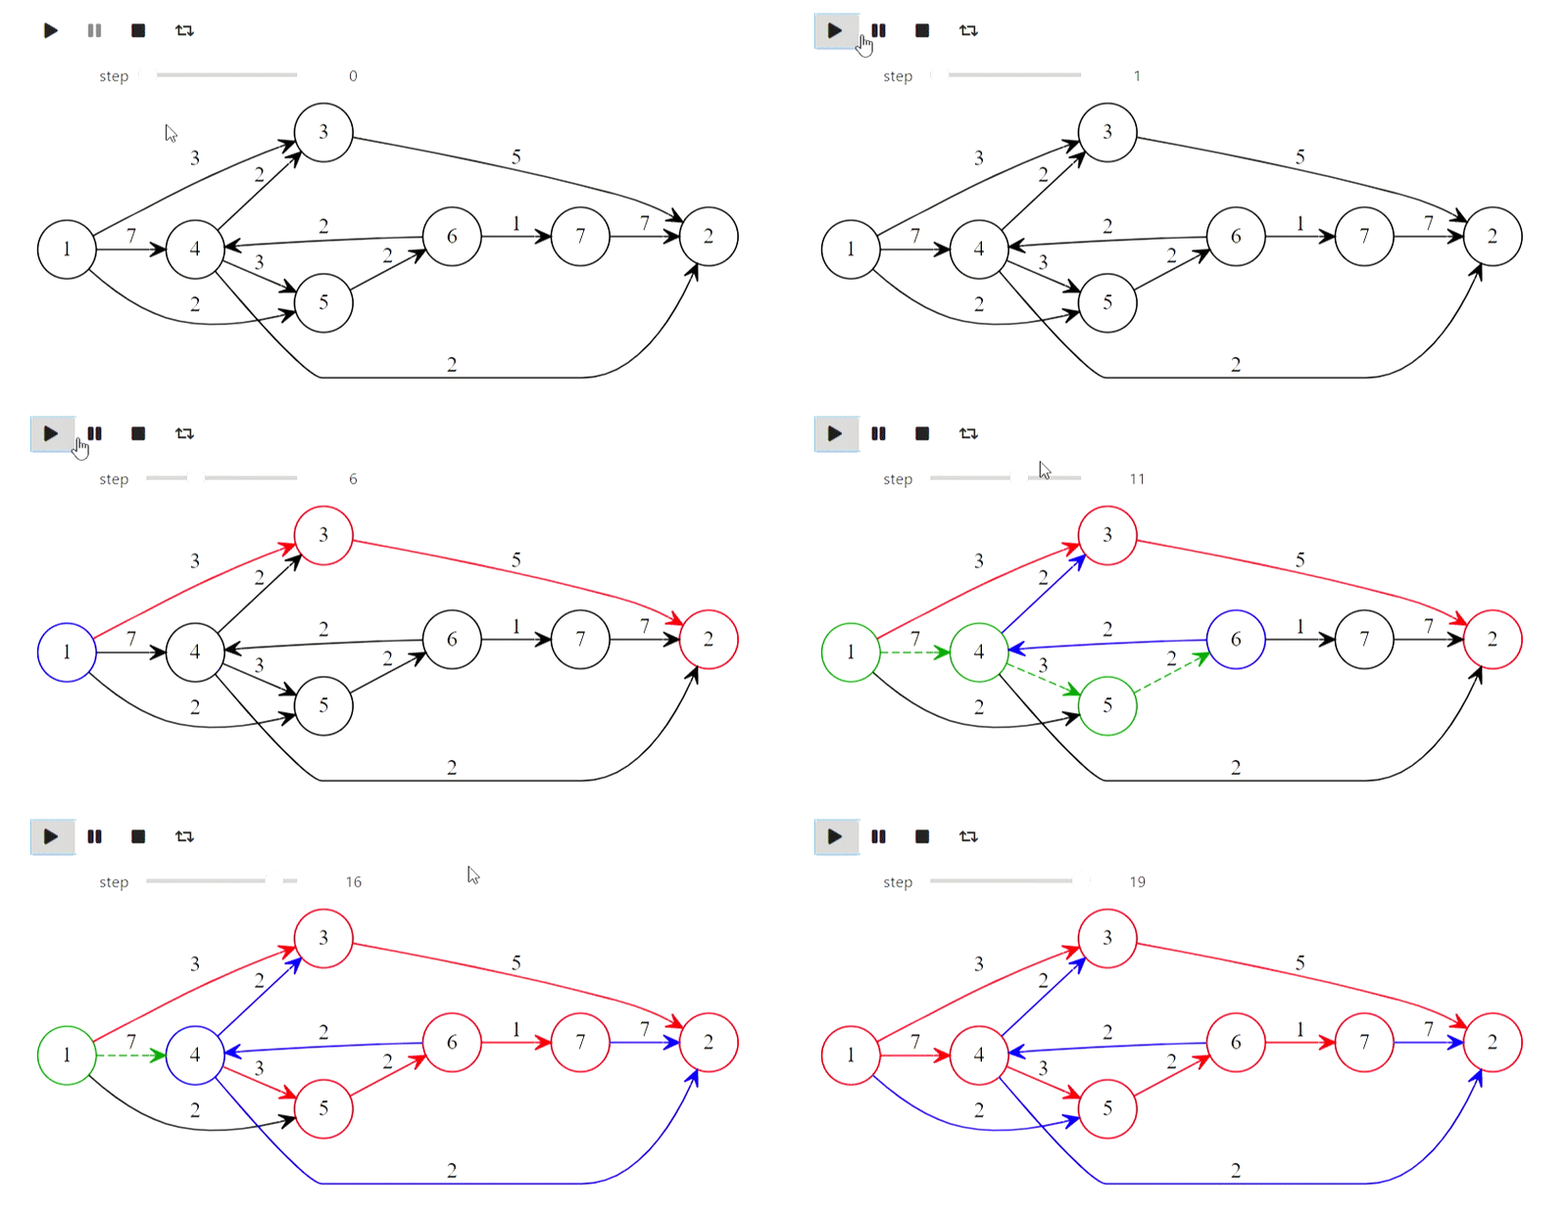

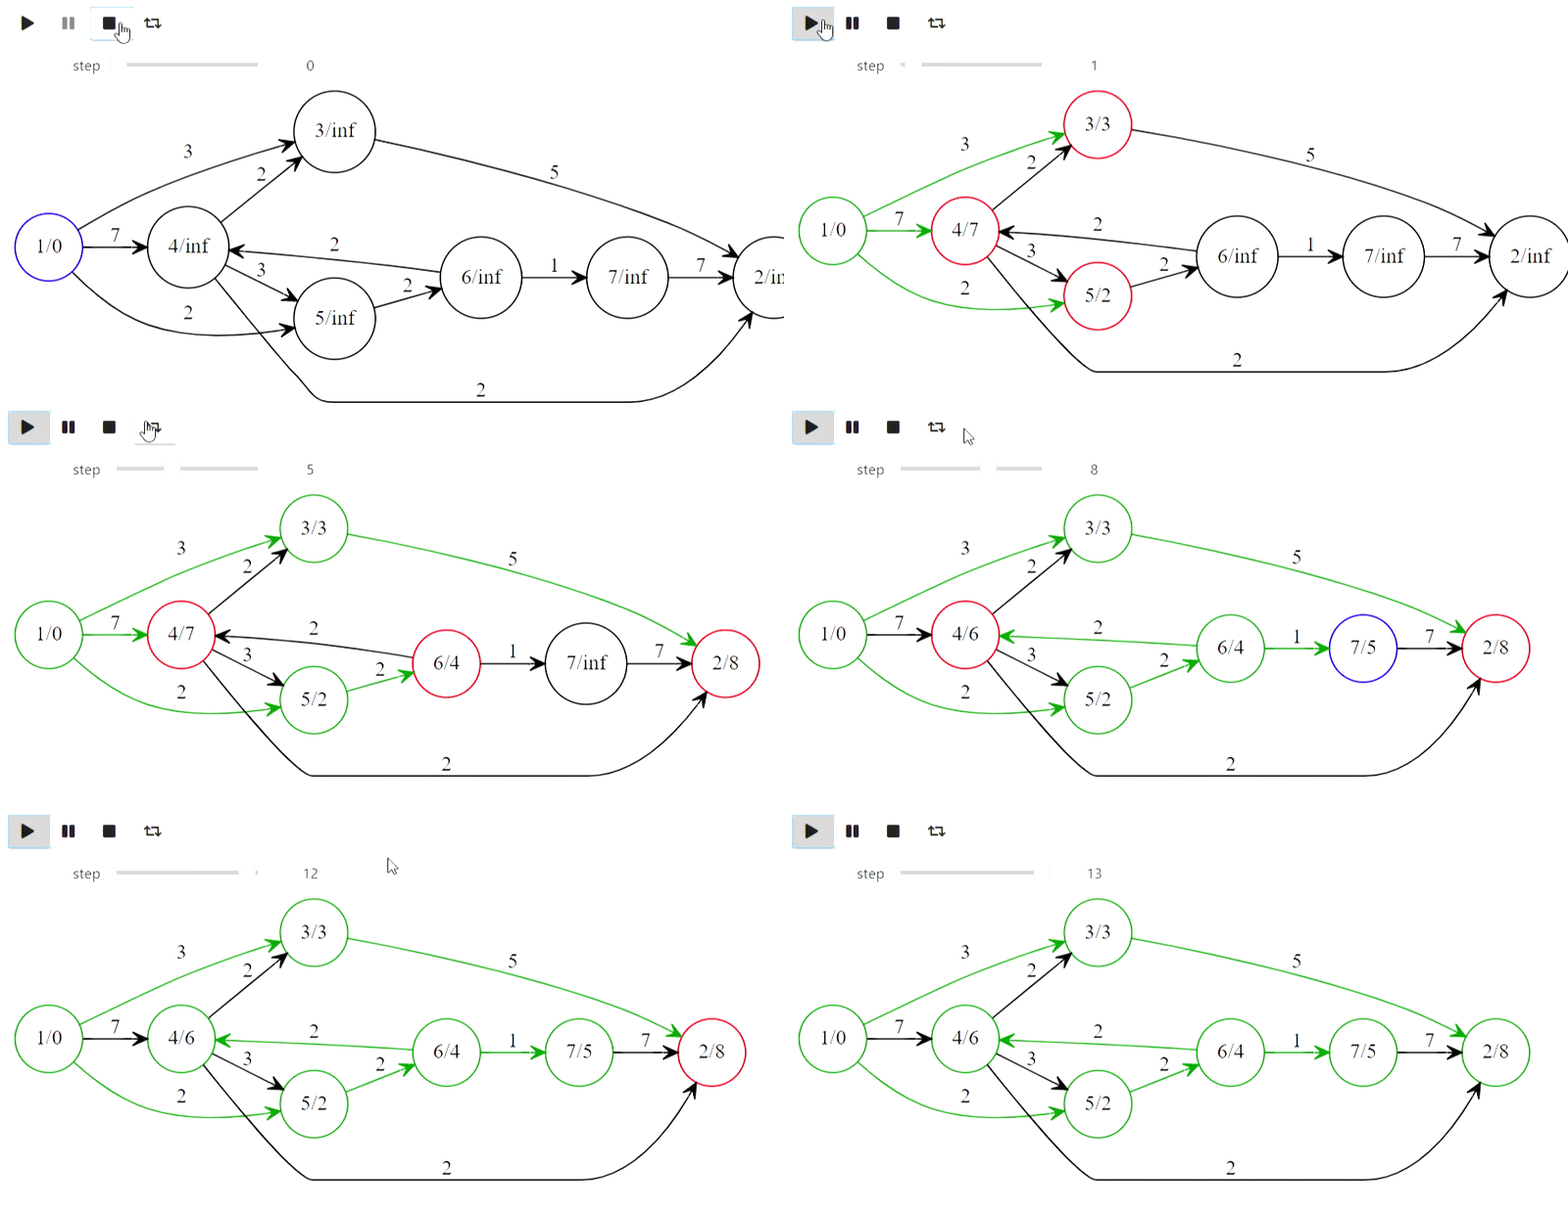
Bueno, aquí está el algoritmo de Dijkstra del título.
El código
def mark_labelled(node):
    node.SetColor('red')

def mark_scanned(node):
    node.SetColor('green')

def process_node(node):
    node.SetColor('blue')

def set_previous(arc):
    arc.SetColor('green')

def unset_previous(arc):
    arc.SetColor('black')

def scan_arc(graph, arc, l, p, mark):
    if l[arc.end] > l[arc.beginning] + arc.weight:
        l[arc.end] = l[arc.beginning] + arc.weight
        if p[arc.end] is not None:
            unset_previous(p[arc.end])
        #  arc,   arc.beginning,
        p[arc.end] = arc
        set_previous(p[arc.end])
        mark[arc.end] = True
        mark_labelled(graph.nodes[arc.end])

def scan_node(graph, node_id, l, p, mark):
    for arc in graph.nodes[node_id].arcs:
        scan_arc(graph, arc, l, p, mark)
    mark[node_id] = False
    mark_scanned(graph.nodes[node_id])


#      ,
#  ,
# http://forskning.diku.dk/PATH05/GoldbergSlides.pdf
def base_scanning_method(graph, s, choice_function):
    l    = {key: float('Inf') for key in graph.nodes.keys()}
    p    = {key: None for key in graph.nodes.keys()}
    mark = {key: False for key in graph.nodes.keys()}

    l[s] = 0
    mark[s] = True
    mark_labelled(graph.nodes[s])

    out_lst = []

    while True:
        node_id = choice_function(l, mark)
        if node_id is None:
            break
        process_node(graph.nodes[node_id])
        out_lst.append(graph.Visualize(l))
        scan_node(graph, node_id, l, p, mark)
        out_lst.append(graph.Visualize(l))
    return l, p, out_lst

#
def least_distance_choice(l, mark):
    labelled = [node_id for node_id, value in mark.items() if value == True]
    if len(labelled) == 0:
        return None
    return min(labelled, key=lambda x: l[x])

graph = Graph(arcs)
l, p, bfs_shortest_path_lst = \
    base_scanning_method(graph, 1, least_distance_choice)
animate_list(bfs_shortest_path_lst, play=True, interval=400);
Resultado


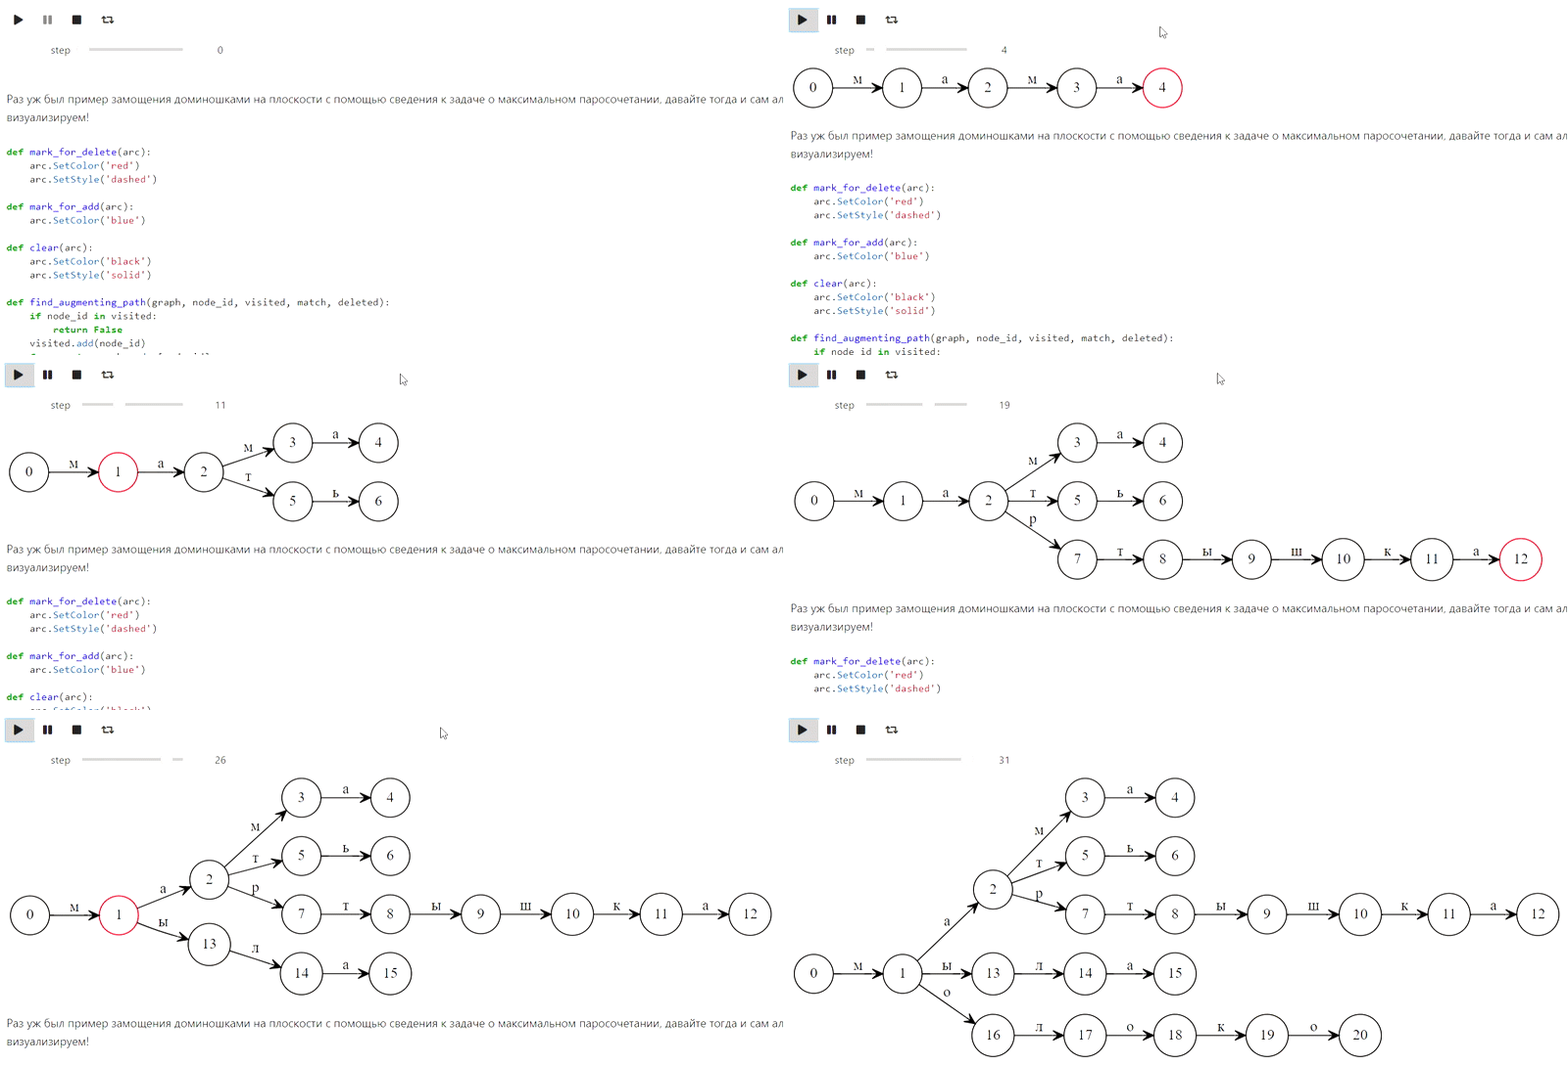
Y así es como se construye el árbol de prefijos para las palabras 'madre', 'madre', 'mono', 'jabón', 'leche':
El código
class TrieNode:
    def __init__(self, parent, word=None):
        #     ,
        #
        self.parent = parent
        #  ,
        self.word = word
        self.children = {}
        self.suff_link = None

def init_trie():
    trie = [TrieNode(-1)]
    return trie

def to_graph(trie):
    arcs = []
    for i, node in enumerate(trie):
        for c, nextstate in node.children.items():
            arcs.append(Arc(i, nextstate, c))
        if node.suff_link is not None and node.suff_link != 0:
            arcs.append(Arc(i,
                            node.suff_link,
                            attributes={"constraint" : "False", "style" : "dashed"}))

    return Graph(arcs)

def add_word(trie, word, steps):
    _num = 0
    for ch in word:
        if not ch in trie[_num].children:
            _n = len(trie)
            trie[_num].children[ch] = _n
            trie.append(TrieNode((_num, ch)))
        _num = trie[_num].children[ch]
        graph = to_graph(trie)
        graph.nodes[_num].SetColor('red')
        steps.append(graph.Visualize())
    trie[_num].word = word

def make_trie(words):
    steps = []
    trie = init_trie()
    steps.append(to_graph(trie).Visualize())
    for word in words:
        add_word(trie, word, steps)
        steps.append(to_graph(trie).Visualize())
    return trie, steps

words = [
    '',
    '',
    '',
    '',
    ''
]
trie, steps = make_trie(words)
animate_list(steps, play=True, interval=500);
Resultado

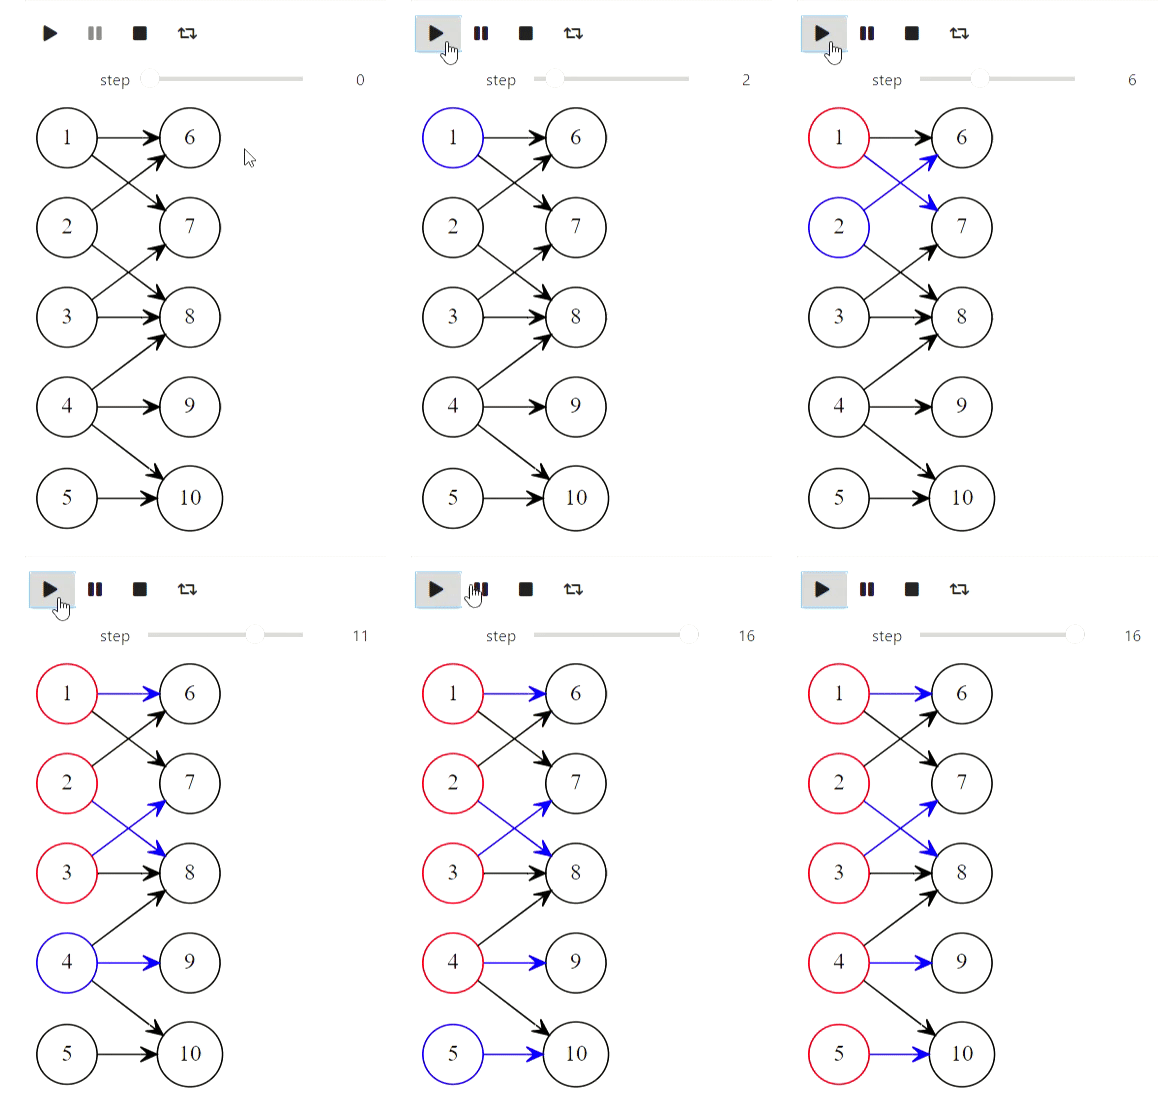
Y finalmente, el algoritmo de Kuhn para encontrar la máxima coincidencia:
El código
def mark_for_delete(arc):
    arc.SetColor('red')
    arc.SetStyle('dashed')

def mark_for_add(arc):
    arc.SetColor('blue')

def clear(arc):
    arc.SetColor('black')
    arc.SetStyle('solid')

def find_augmenting_path(graph, node_id, visited, match, deleted):
    if node_id in visited:
        return False
    visited.add(node_id)
    for arc in graph.nodes[node_id].arcs:
        if arc.end not in match or find_augmenting_path(graph, match[arc.end].beginning, visited, match, deleted):
            if arc.end in match:
                mark_for_delete(match[arc.end])
                deleted.append(match[arc.end])
            match[arc.end] = arc
            mark_for_add(arc)
            return True
    return False

def kuhns_matching(graph, first_part):
    states = [graph.Visualize()]
    match = dict()
    for node_id in first_part:
        node = graph.nodes[node_id]
        node.SetColor('Blue')
        states.append(graph.Visualize())
        deleted = []
        if find_augmenting_path(graph, node_id, set(), match, deleted):
            states.append(graph.Visualize())
            for arc in deleted:
                clear(arc)
            states.append(graph.Visualize())
        node.SetColor('red')
    states.append(graph.Visualize())
    return states

arcs = [
    Arc(1, 6),
    Arc(1, 7),
    Arc(2, 6),
    Arc(3, 7),
    Arc(3, 8),
    Arc(4, 8),
    Arc(4, 9),
    Arc(4, 10),
    Arc(5, 10),
    Arc(2, 8)
]
first_part = [1, 2, 3, 4, 5]
graph = Graph(arcs)
states = kuhns_matching(graph, first_part)

animate_list(states, play=True, interval=400);
Resultado

Algoritmos con matrices
Pero esta parte se refiere al intento fallido. IPython.display puede analizar el látex, pero cuando intenté usarlo, esto es lo que obtuve (debería haber habido un método gaussiano):
El código
from animation_utils.latex import Matrix
from IPython.display import Math

n = 5
A = np.random.rand(n, n)
L = np.identity(n)
U = np.array(A)
steps = []
steps.append(Math(str(Matrix(L)) + str(Matrix(U))))
for k in range(n):
    x = U[k,k]
    for i in range(k+1, n):
        L[i,k] = U[i,k] / x
        U[i,k:] -= L[i,k] * U[k,k:]
    steps.append(Math(str(Matrix(L)) + str(Matrix(U))))

animate_list(steps, play=True, interval=500);
Resultado


Hasta ahora no sé qué hacer con esto, pero tal vez la gente con conocimientos lo pida.