Buen día, queridos lectores de habr, el 12 de agosto de 2020 se publicaron las etapas de mudanza bajo el programa de renovación (lo pueden encontrar aquí ) y me preguntaba cómo quedaría si se visualizaran estas etapas. Aquí es necesario aclarar que no estoy de ninguna manera relacionado con el gobierno de Moscú, pero soy el feliz dueño de un apartamento en un edificio para renovación, por lo que estaba interesado en ver, tal vez incluso con cierta precisión, adivinar hacia dónde se movería la ola de renovación en mi caso (y tal vez en el tuyo, si te interesa esto, querido lector). Por supuesto, un pronóstico preciso no funcionará, pero al menos será posible ver la imagen desde un nuevo ángulo.
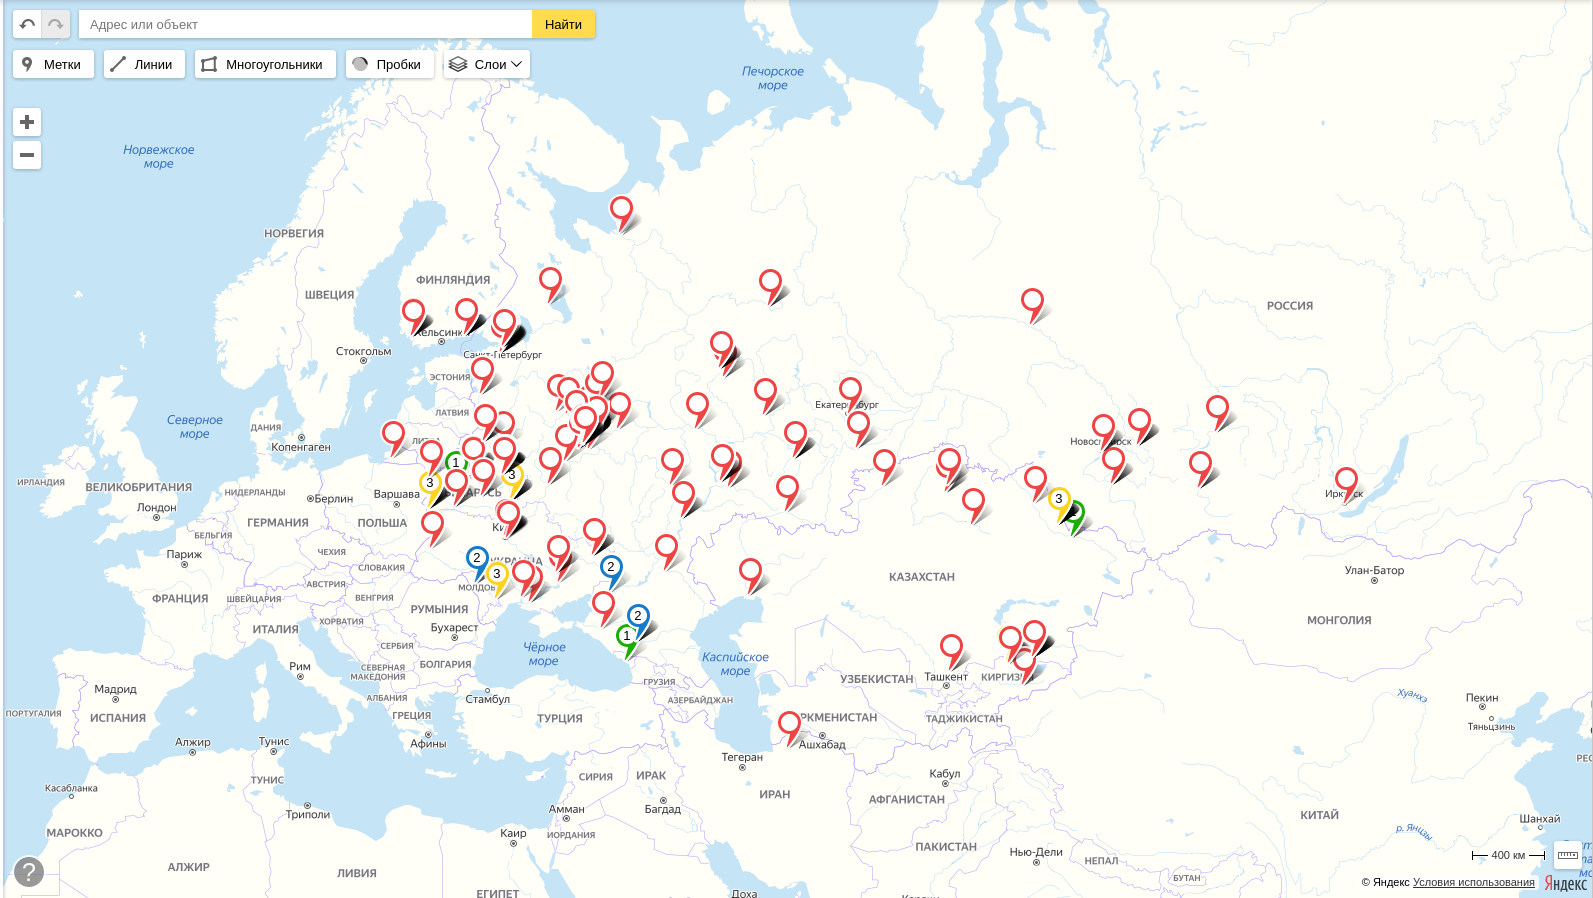
UPD 28 de agosto de 2020 Obtuvimos
un mapa de renovación completo con olas de renovación y sitios de lanzamiento marcados en él.
Introducción
12 2020 . № 45/182/-335/20 ( ) 2032 ( ):
- 2020 — 2024., 930 , 3-29
- 2025 — 2028., 1636 , 30-76
- 2029 — 2032., 1809 , 77-128
- ( 1 2021.) — 688 , 129-148
- , . , .
, .. — pdf , tabula pdf .
import pandas as pd
import numpy as np
import requests
from tabula import read_pdf
import json
import os
, , .
test = read_pdf('prikaz_grafikpereseleniya.pdf', pages='3', pandas_options={'header':None})test.head()| 0 | 1 | 2 | 3 | 4 | 5 | |
|---|---|---|---|---|---|---|
| 0 | No / | NaN | unom | |||
| 1 | 1 | ., .49 c.4 | NaN | 1316 | ||
| 2 | 2 | ., .77 c.3 | NaN | 1327 | ||
| 3 | 3 | ., .2/26 | NaN | 19328 | ||
| 4 | 4 | ., .3 | NaN | 31354 |
, , , parse_pdf_table.
def parse_pdf_table(pages, pdf_file='prikaz_grafikpereseleniya.pdf'):
    df = read_pdf(pdf_file, pages=pages, pandas_options={'header':None})

    #
    df = df[~(df.iloc[:,0] == 'No /')]

    #
    df = df.iloc[:,1:4]
    df.columns = ['AO', 'district', 'address']

    return df
, , .. , pdf . ( , .. )
wave_1 = parse_pdf_table('3-29') # 2020 - 2024
wave_1['wave'] = 1wave_1.shape(930, 4)wave_2 = parse_pdf_table('30-76') # 2025 - 2028
wave_2['wave'] = 2wave_2.shape(1636, 4)wave_3 = parse_pdf_table('77-128') # 2029 - 2032
wave_3['wave'] = 3wave_3.shape(1809, 4)unknown = parse_pdf_table('129-148')
unknown['wave'] = 0unknown.shape(688, 4) (pandas), df.
df = pd.concat([wave_1, wave_2, wave_3, unknown], ignore_index=True).
df['marker-color'] = df['wave'].map({1:'#0ACF00', #
2:'#1142AA', #
3:'#FFFD00', #
0:'#FD0006'}) # .
df['iconContent'] = df['wave'].map({1:'1',
2:'2',
3:'3',
0:''}).
df['description'] = df['address']— , , , , , . ( ! :)
def add_city(x):
if x['AO'] == '':
return ', ' + x['address']
return ', ' + x['address']df['address'] = df[['AO', 'address']].apply(add_city, axis=1)def geocoder(addr, key=' '):
url = 'https://geocode-maps.yandex.ru/1.x'
params = {'format':'json', 'apikey': key, 'geocode': addr}
response = requests.get(url, params=params)
try:
coordinates = response.json()["response"]["GeoObjectCollection"]["featureMember"][0]["GeoObject"]["Point"]["pos"]
lon, lat = coordinates.split(' ')
except:
lon, lat = 0, 0
return lon, lat%%time
df['longitude'], df['latitude'] = zip(*df['address'].apply(geocoder))CPU times: user 2min 11s, sys: 4.31 s, total: 2min 15s
Wall time: 15min 14s( , .. , ), - - .
len(df[df['longitude'] == 0])0.
df.to_csv('waves.csv')#df = pd.read_csv('waves.csv')def df_to_geojson(df, properties, lat='latitude', lon='longitude'):
geojson = {'type':'FeatureCollection', 'features':[]}
for _, row in df.iterrows():
feature = {'type':'Feature',
'properties':{},
'geometry':{'type':'Point',
'coordinates':[]}}
feature['geometry']['coordinates'] = [row[lon],row[lat]]
for prop in properties:
feature['properties'][prop] = row[prop]
geojson['features'].append(feature)
return geojson.. , , .
properties = ['marker-color', 'iconContent', 'description']
if not os.path.exists('data'):
os.makedirs('data')
for ao, data in df.groupby('AO'):
geojson = df_to_geojson(data, properties)
with open('data/' + ao + '.geojson', 'w') as f:
json.dump(geojson, f, indent=2) .geojson data. _.geojson .
geojson = df_to_geojson(df, properties)
with open('data/_.geojson', 'w') as f:
json.dump(geojson, f, indent=2) 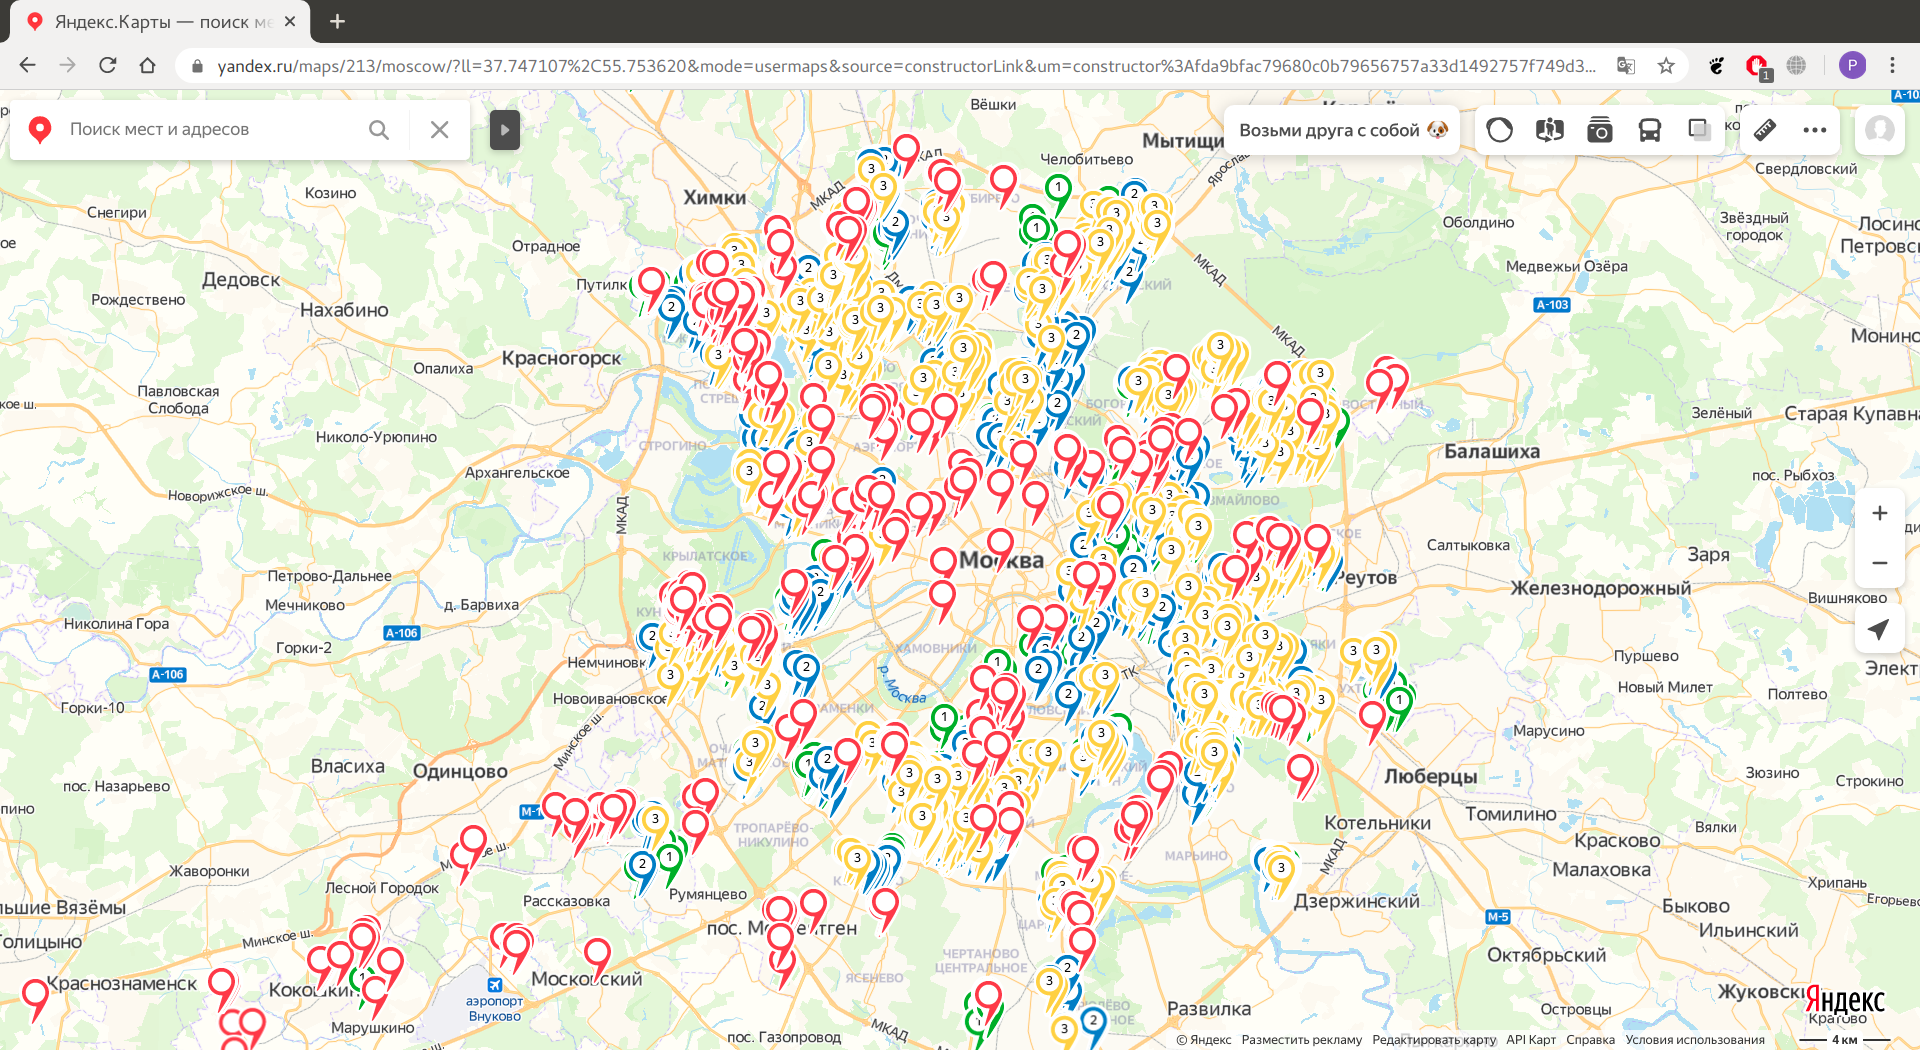

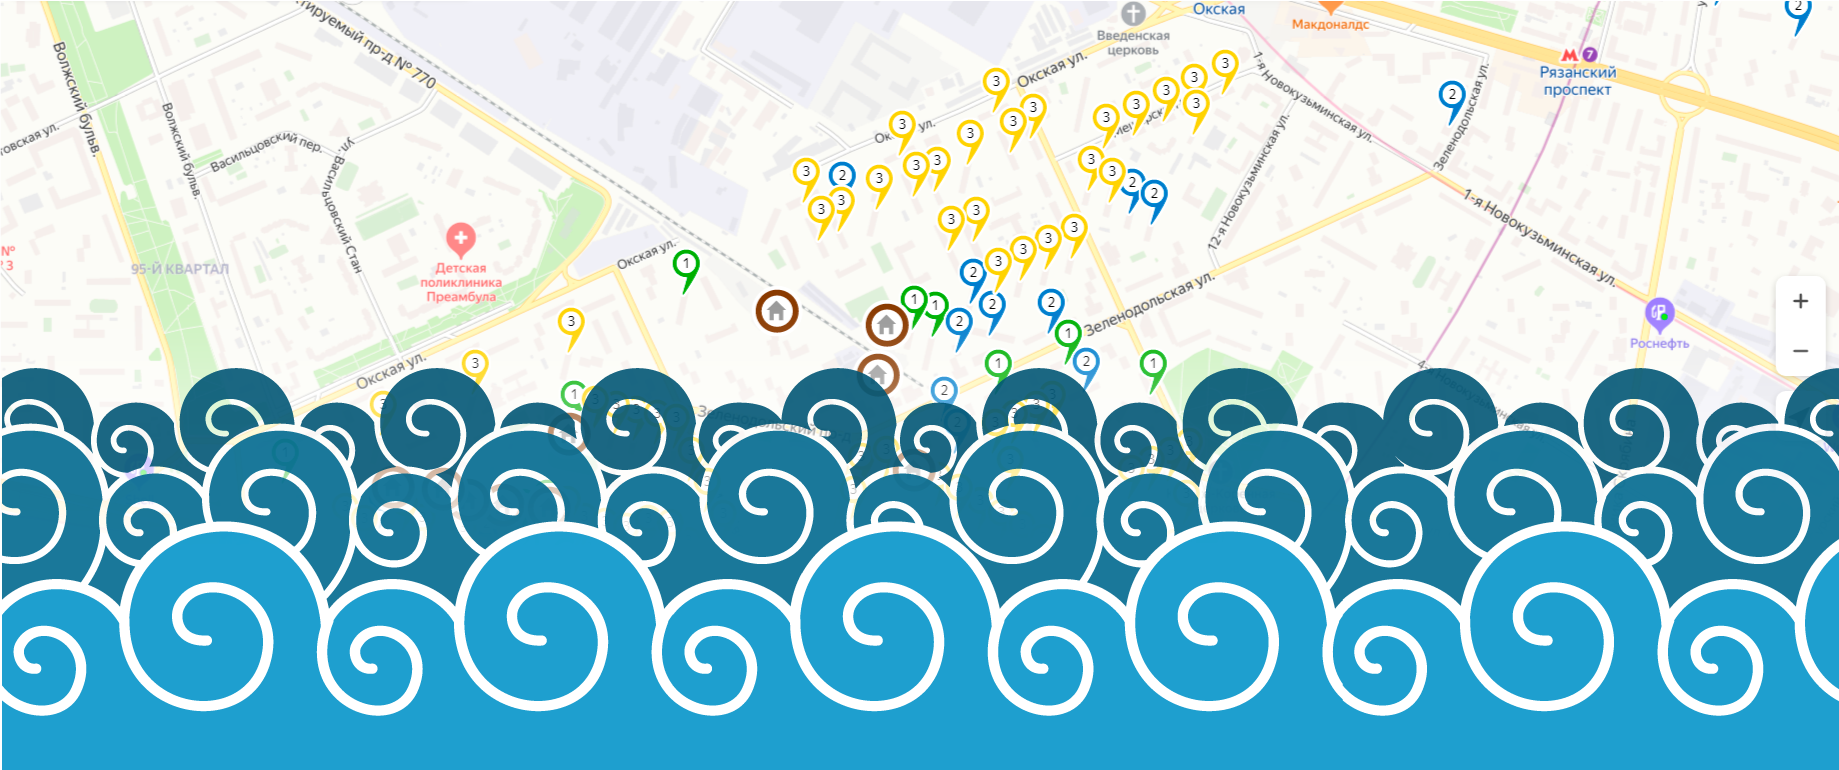
, , , , — (.), .1 - — . (. , .), .8//. ( , )
, :(
, . , , , , , , , . 39, , . 6, — , . 1, 2, 3, . 38.
— !

- , , . , PbIXTOP, .
2.0
import pandas as pd
import numpy as np
import json
from tabula import read_pdf
from tqdm.notebook import tqdm
import os
with open('renovation_address.txt') as f:
bounded_addresses = json.load(f)def parse_pdf_table(pages, pdf_file='prikaz_grafikpereseleniya.pdf'):
df = read_pdf(pdf_file, pages=pages, pandas_options={'header':None})
#
df = df[~(df.iloc[:,0] == 'No /')]
df['unom'] = df.iloc[:,-1].combine_first(df.iloc[:,-2])
#
df = df.iloc[:,[1, 2, 3, -1]]
df.columns = ['AO', 'district', 'description', 'unom']
return dfwave_1 = parse_pdf_table('3-29') # 2020 - 2024
wave_1['wave'] = 1
wave_2 = parse_pdf_table('30-76') # 2025 - 2028
wave_2['wave'] = 2
wave_3 = parse_pdf_table('77-128') # 2029 - 2032
wave_3['wave'] = 3
unknown = parse_pdf_table('129-148')
unknown['wave'] = 0df = pd.concat([wave_1, wave_2, wave_3, unknown], ignore_index=True)df['marker-color'] = df['wave'].map({1:'#0ACF00', #
2:'#1142AA', #
3:'#FFFD00', #
0:'#FD0006'}) #
df['iconContent'] = df['wave'].map({1:'1',
                                    2:'2',
                                    3:'3',
0:''})df['longitude'] = 0
df['latitude'] = 0for i in tqdm(bounded_addresses):
unom = i['unom']
coordinates = i['center']['coordinates']
df.loc[df['unom']==unom, 'longitude'] = coordinates[1]
df.loc[df['unom']==unom, 'latitude'] = coordinates[0]HBox(children=(FloatProgress(value=0.0, max=5152.0), HTML(value='')))# , ..
df.loc[(df['AO'] == '') | (df['AO'] == ''), 'AO'] = ''df[df['longitude'] == 0]| AO | district | description | unom | wave | marker-color | iconContent | longitude | latitude | |
|---|---|---|---|---|---|---|---|---|---|
| 917 | - | . (.-), .11 | 15000016 | 1 | #0ACF00 | 1 | 0.0 | 0.0 | |
| 918 | - | . (.-), .13 | 15000015 | 1 | #0ACF00 | 1 | 0.0 | 0.0 | |
| 919 | - | . (.-), .3 | 15000013 | 1 | #0ACF00 | 1 | 0.0 | 0.0 | |
| 925 | - | . (.-), .4 | 15000012 | 1 | #0ACF00 | 1 | 0.0 | 0.0 | |
| 926 | - | . (.-), .6 | 15000014 | 1 | #0ACF00 | 1 | 0.0 | 0.0 | |
| 4883 | . (. , .)... | 4405823 | 0 | #FD0006 | 0.0 | 0.0 | |||
| 4945 | . (., /), .51 | 20000002 | 0 | #FD0006 | 0.0 | 0.0 | |||
| 4946 | . (., /), .52 | 20000003 | 0 | #FD0006 | 0.0 | 0.0 | |||
| 4947 | . (., /), .53 | 20000001 | 0 | #FD0006 | 0.0 | 0.0 | |||
| 4948 | . (., /), .85 | 20000000 | 0 | #FD0006 | 0.0 | 0.0 | |||
| 4995 | (.), .1 | 20000004 | 0 | #FD0006 | 0.0 | 0.0 |
,
df.loc[917, ['longitude', 'latitude']] = 37.204805, 55.385382
df.loc[918, ['longitude', 'latitude']] = 37.205255, 55.385367
df.loc[919, ['longitude', 'latitude']] = 37.201518, 55.385265
df.loc[925, ['longitude', 'latitude']] = 37.201545, 55.384927
df.loc[926, ['longitude', 'latitude']] = 37.204151, 55.384576
df.loc[4883, ['longitude', 'latitude']] = 37.321218, 55.661308
df.loc[4945, ['longitude', 'latitude']] = 37.476896, 55.604153
df.loc[4946, ['longitude', 'latitude']] = 37.477406, 55.603895
df.loc[4947, ['longitude', 'latitude']] = 37.476546, 55.602729
df.loc[4948, ['longitude', 'latitude']] = 37.477568, 55.604659
df.loc[4995, ['longitude', 'latitude']] = 37.176806, 55.341541
with open('start_area.txt') as f:
end = json.load(f)data = {
'AO':[],
'district':[],
'longitude':[],
'latitude':[],
'description':[]
}
for i in end['response']:
data['AO'].append(i['OKRUG'])
data['district'] = i['AREA']
coordinates = i['geoData']['coordinates']
data['longitude'].append(coordinates[1])
data['latitude'].append(coordinates[0])
description = i['Address']
if 'StartOfRelocation' in i:
if i['StartOfRelocation'] is not None:
description += '\n' + i['StartOfRelocation']
data['description'].append(description)
df_start_area = pd.DataFrame(data)
df_start_area['marker-color'] = '#7D3E00' #
df_start_area['iconContent'] = '0'
df_start_area['unom'] = None
df_start_area['wave'] = -1
df = pd.concat([df, df_start_area], ignore_index=True)
def df_to_geojson(df, properties, lat='latitude', lon='longitude'):
    geojson = {'type':'FeatureCollection', 'features':[]}
    for _, row in df.iterrows():
        feature = {'type':'Feature',
                   'properties':{},
                   'geometry':{'type':'Point',
                               'coordinates':[]}}
        feature['geometry']['coordinates'] = [row[lon],row[lat]]
        for prop in properties:
            feature['properties'][prop] = row[prop]
        geojson['features'].append(feature)
return geojsonproperties = ['marker-color', 'iconContent', 'description'].
if not os.path.exists('data'):
os.makedirs('data')
for ao, data in df.groupby('AO'):
geojson = df_to_geojson(data, properties)
with open('data/' + ao + '.geojson', 'w') as f:
json.dump(geojson, f, indent=2) ( )
geojson = df_to_geojson(df, properties)

with open('data/_.geojson', 'w') as f:
json.dump(geojson, f, indent=2) , , , , , , , .
UPD 28 2020
.
PbIXTOP , .
UPD 1 2020
Se agregó el código real para generar el mapa, se ocultó la implementación, porque la mayoría de los lectores del artículo solo están interesados en el mapa.
Gracias por su atención.